Reporting on Construction Safety Compliance with New Dashboards
-78%
Reduction in TRIR (Total Recordable Incident Rate)†
TRIR is the amount of recorded safety incidents resulting in accidents, injury or death.
-79%
Lower DART rate (Days Away, Restricted, or Transferred)†
DART is the amount of safety incidents so serious that they result in effected workers taking leave from work, having their work duties restricted, or being transferred.
†2025 Annual Safety Performance Report, Associated Builders and Contractors (ABC)
1. Context
Neglecting to hold scheduled Toolbox Talks results in higher rates of job related injuries
Construction companies that hold daily Toolbox Talks see a 78% reduction in incidents (TRIR) and a 79% lower rate of serious incidents (DART). (2025 Annual Safety Performance Report, Associated Builders and Contractors ABC)
Construction companies are mandated by OSHA to maintain safe working environments, and one of the ways they do this by holding Toolbox Talks daily or weekly, in order to educate workers on safety hazards and guidelines.
If a company is neglecting their Toolbox Talks, they risk OSHA scrutiny, higher insurance costs, and especially worker injury or death.
2. Research & Discovery
Safety managers need data to see that construction safety remains a top priority
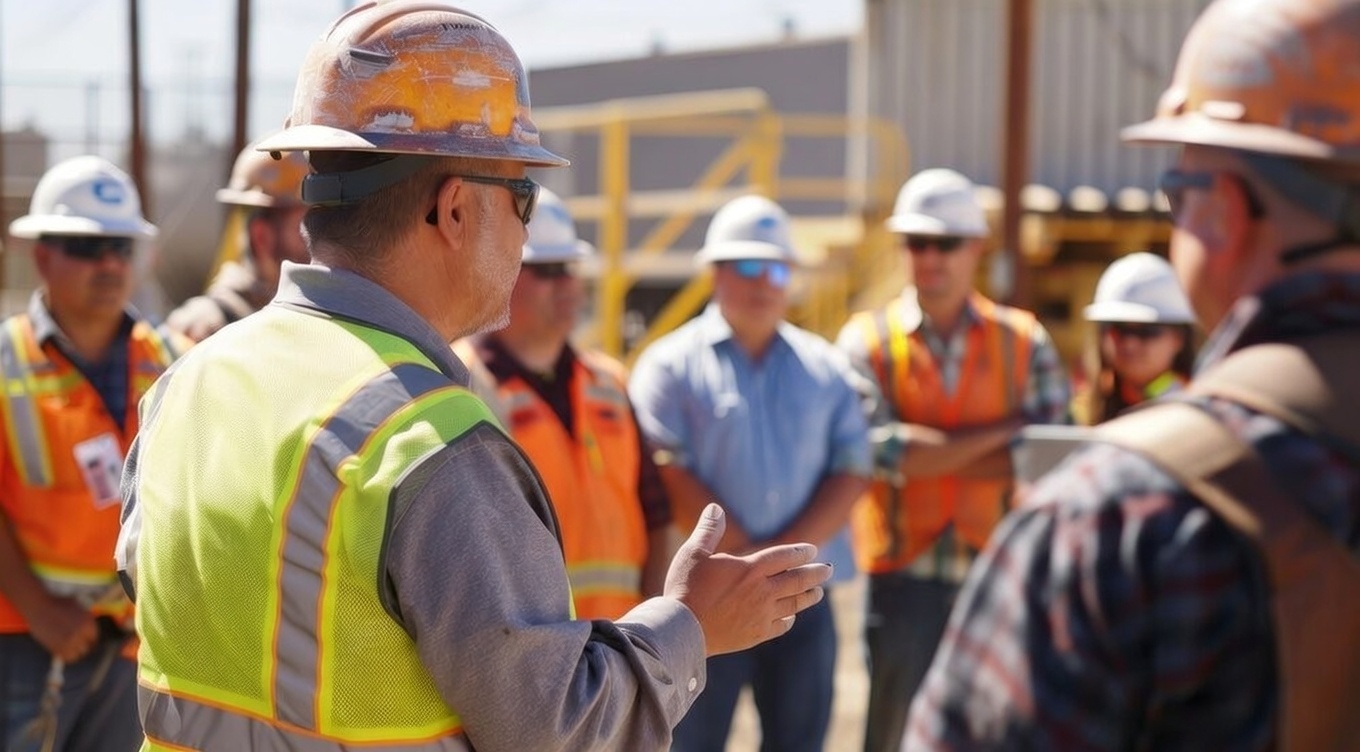
Construction laborers risk their safety and even their lives everyday, and its the job of the foreman as well as the safety managers, to ensure workers are educated on risks and remedies pertaining to certain types of work.
Working with dangerous chemicals, at great heights, and even extreme temperatures, are all topics that SafetyHQ's Toolbox Talk library covers.
While foremen conduct these educational meetings, it's safety managers who are repsonsible for making sure foremen are held accountable.
3. Problem Definition
Without seeing trending data on Toolbox Talk compliance, companies are blind to the frequency these necessary precautions are followed
SafetyHQ had pieces of safety compliance data scattered throughout the product; foremen have a list of TBTs they've conducted, and workers a list of TBTs they've attended.
But reporting on trends from an overhead view was missing from the product.
If safety managers could see how frequently a foreman or a worker was conducting/attending TBTs, this gives them an idea on how much the company culture values worker safety and prevents incidents and injuries.
4. solution strategy
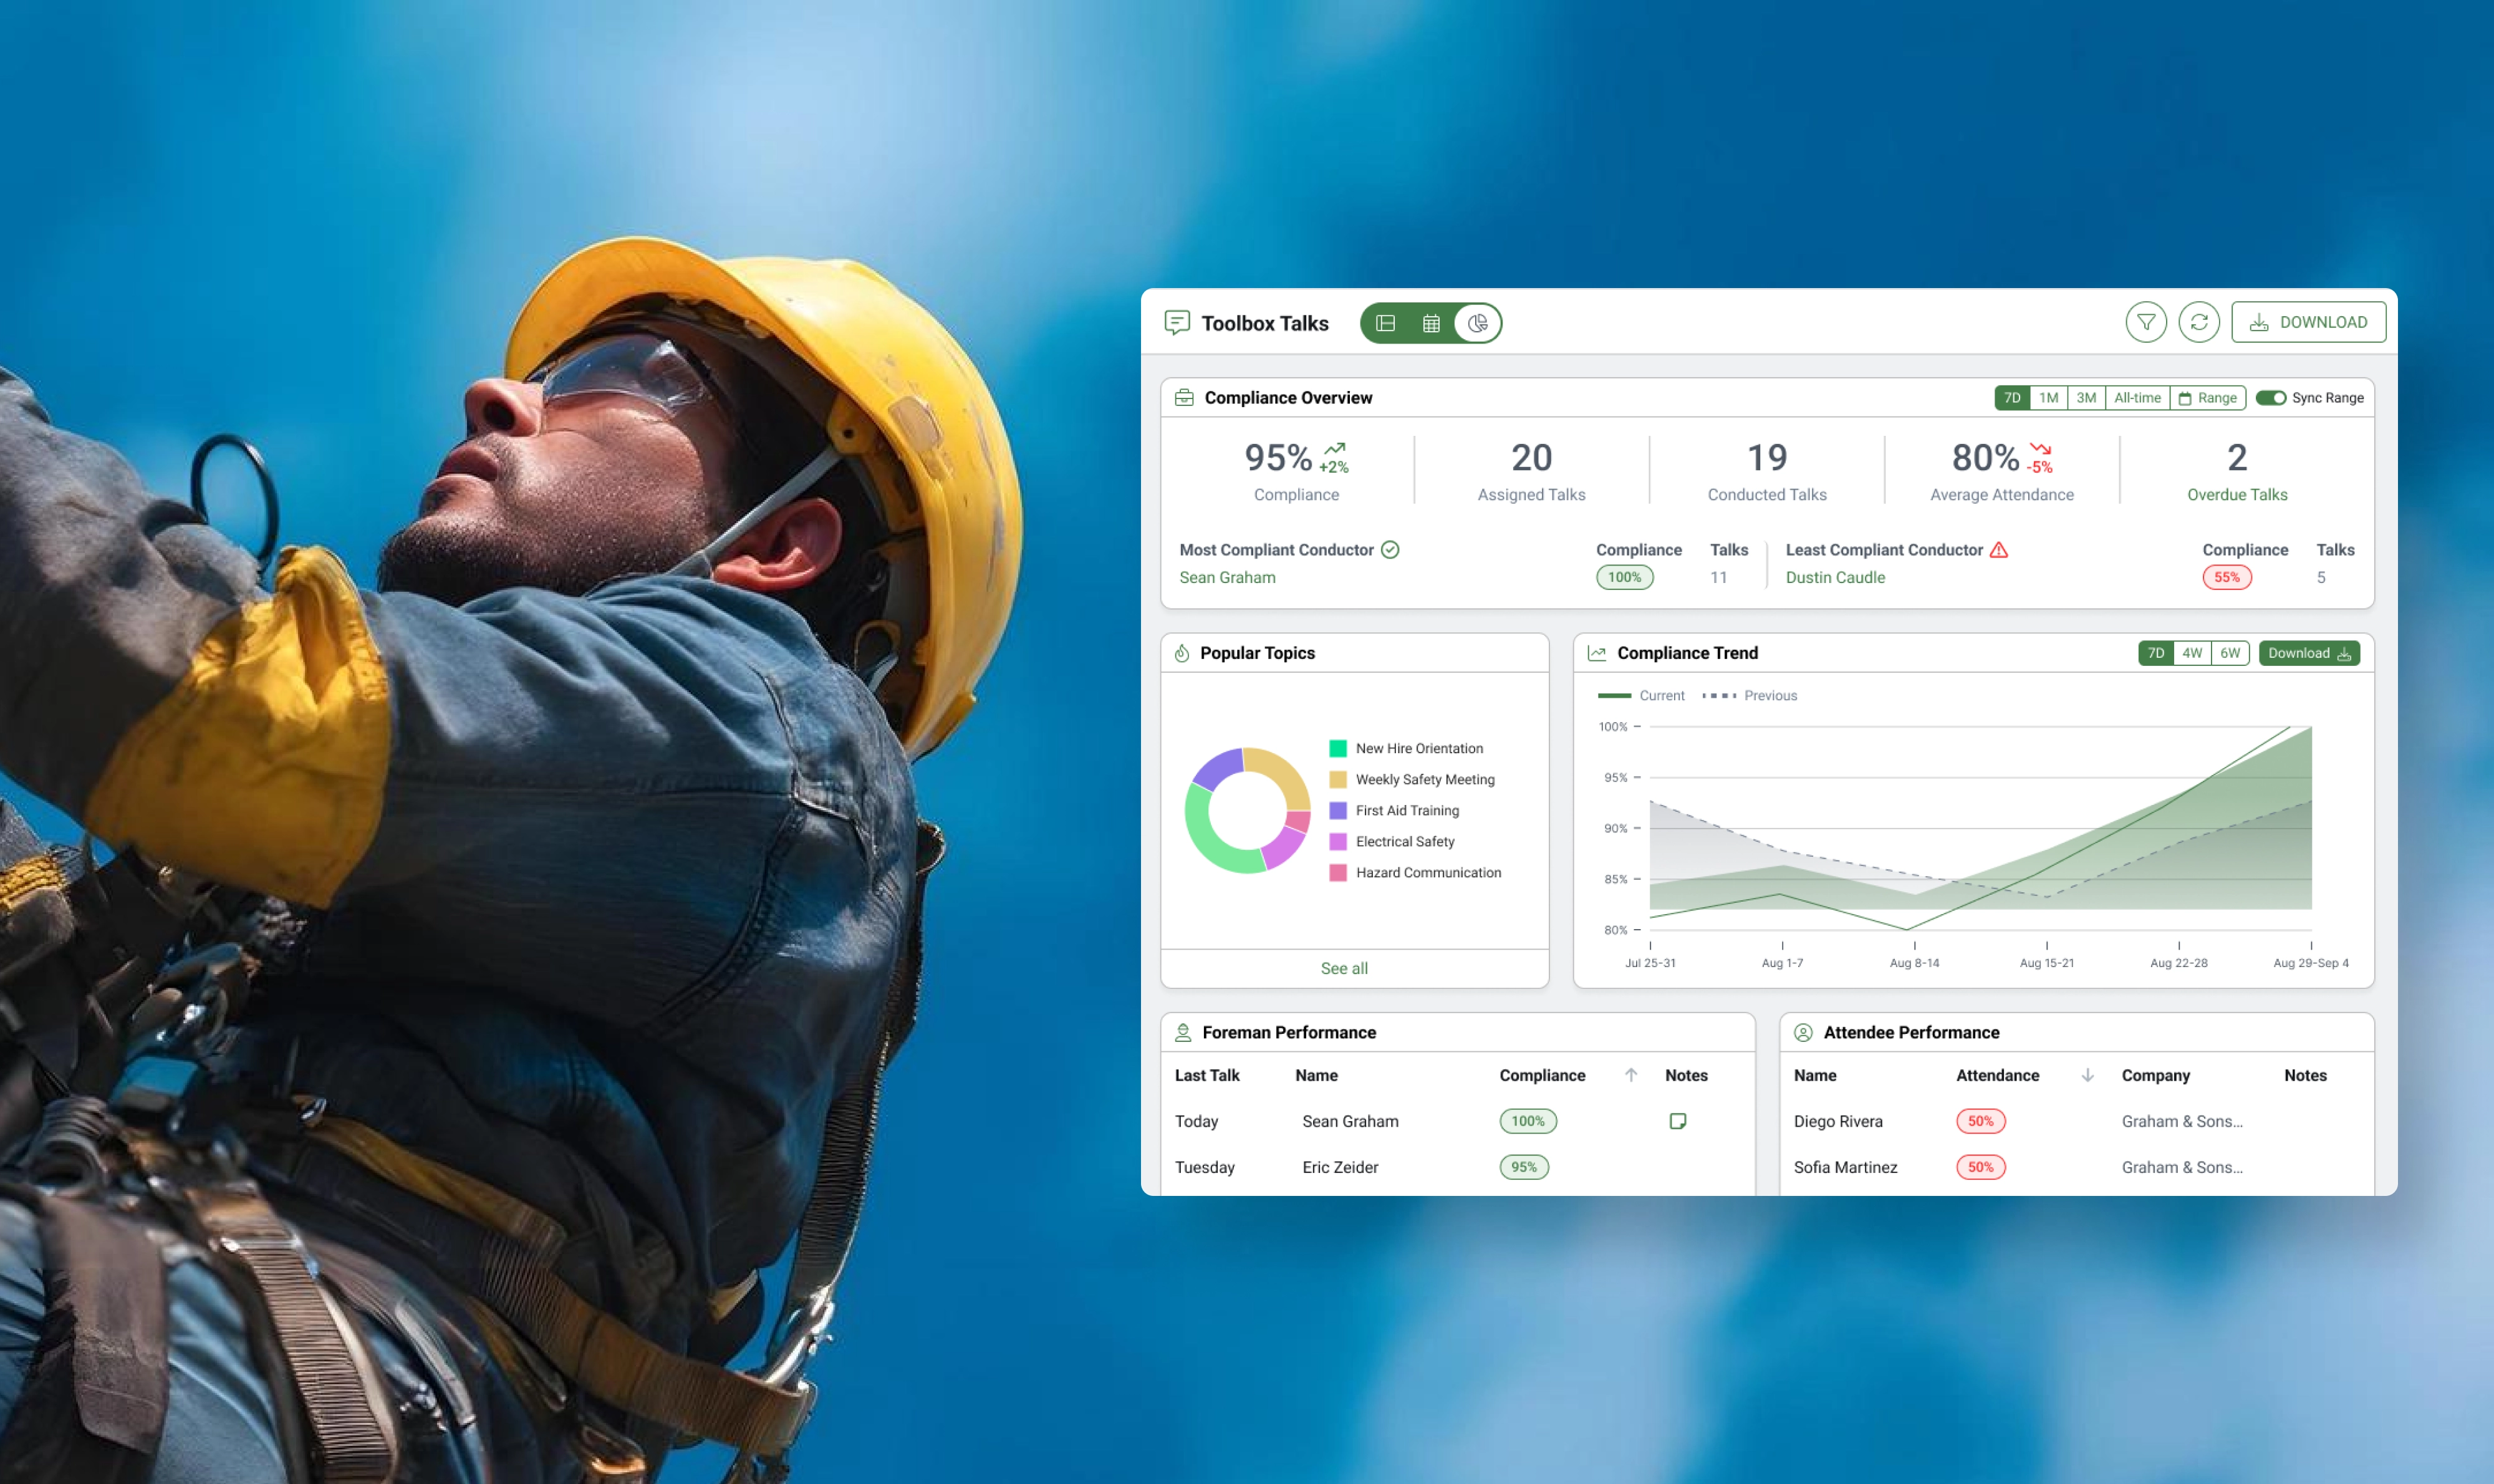
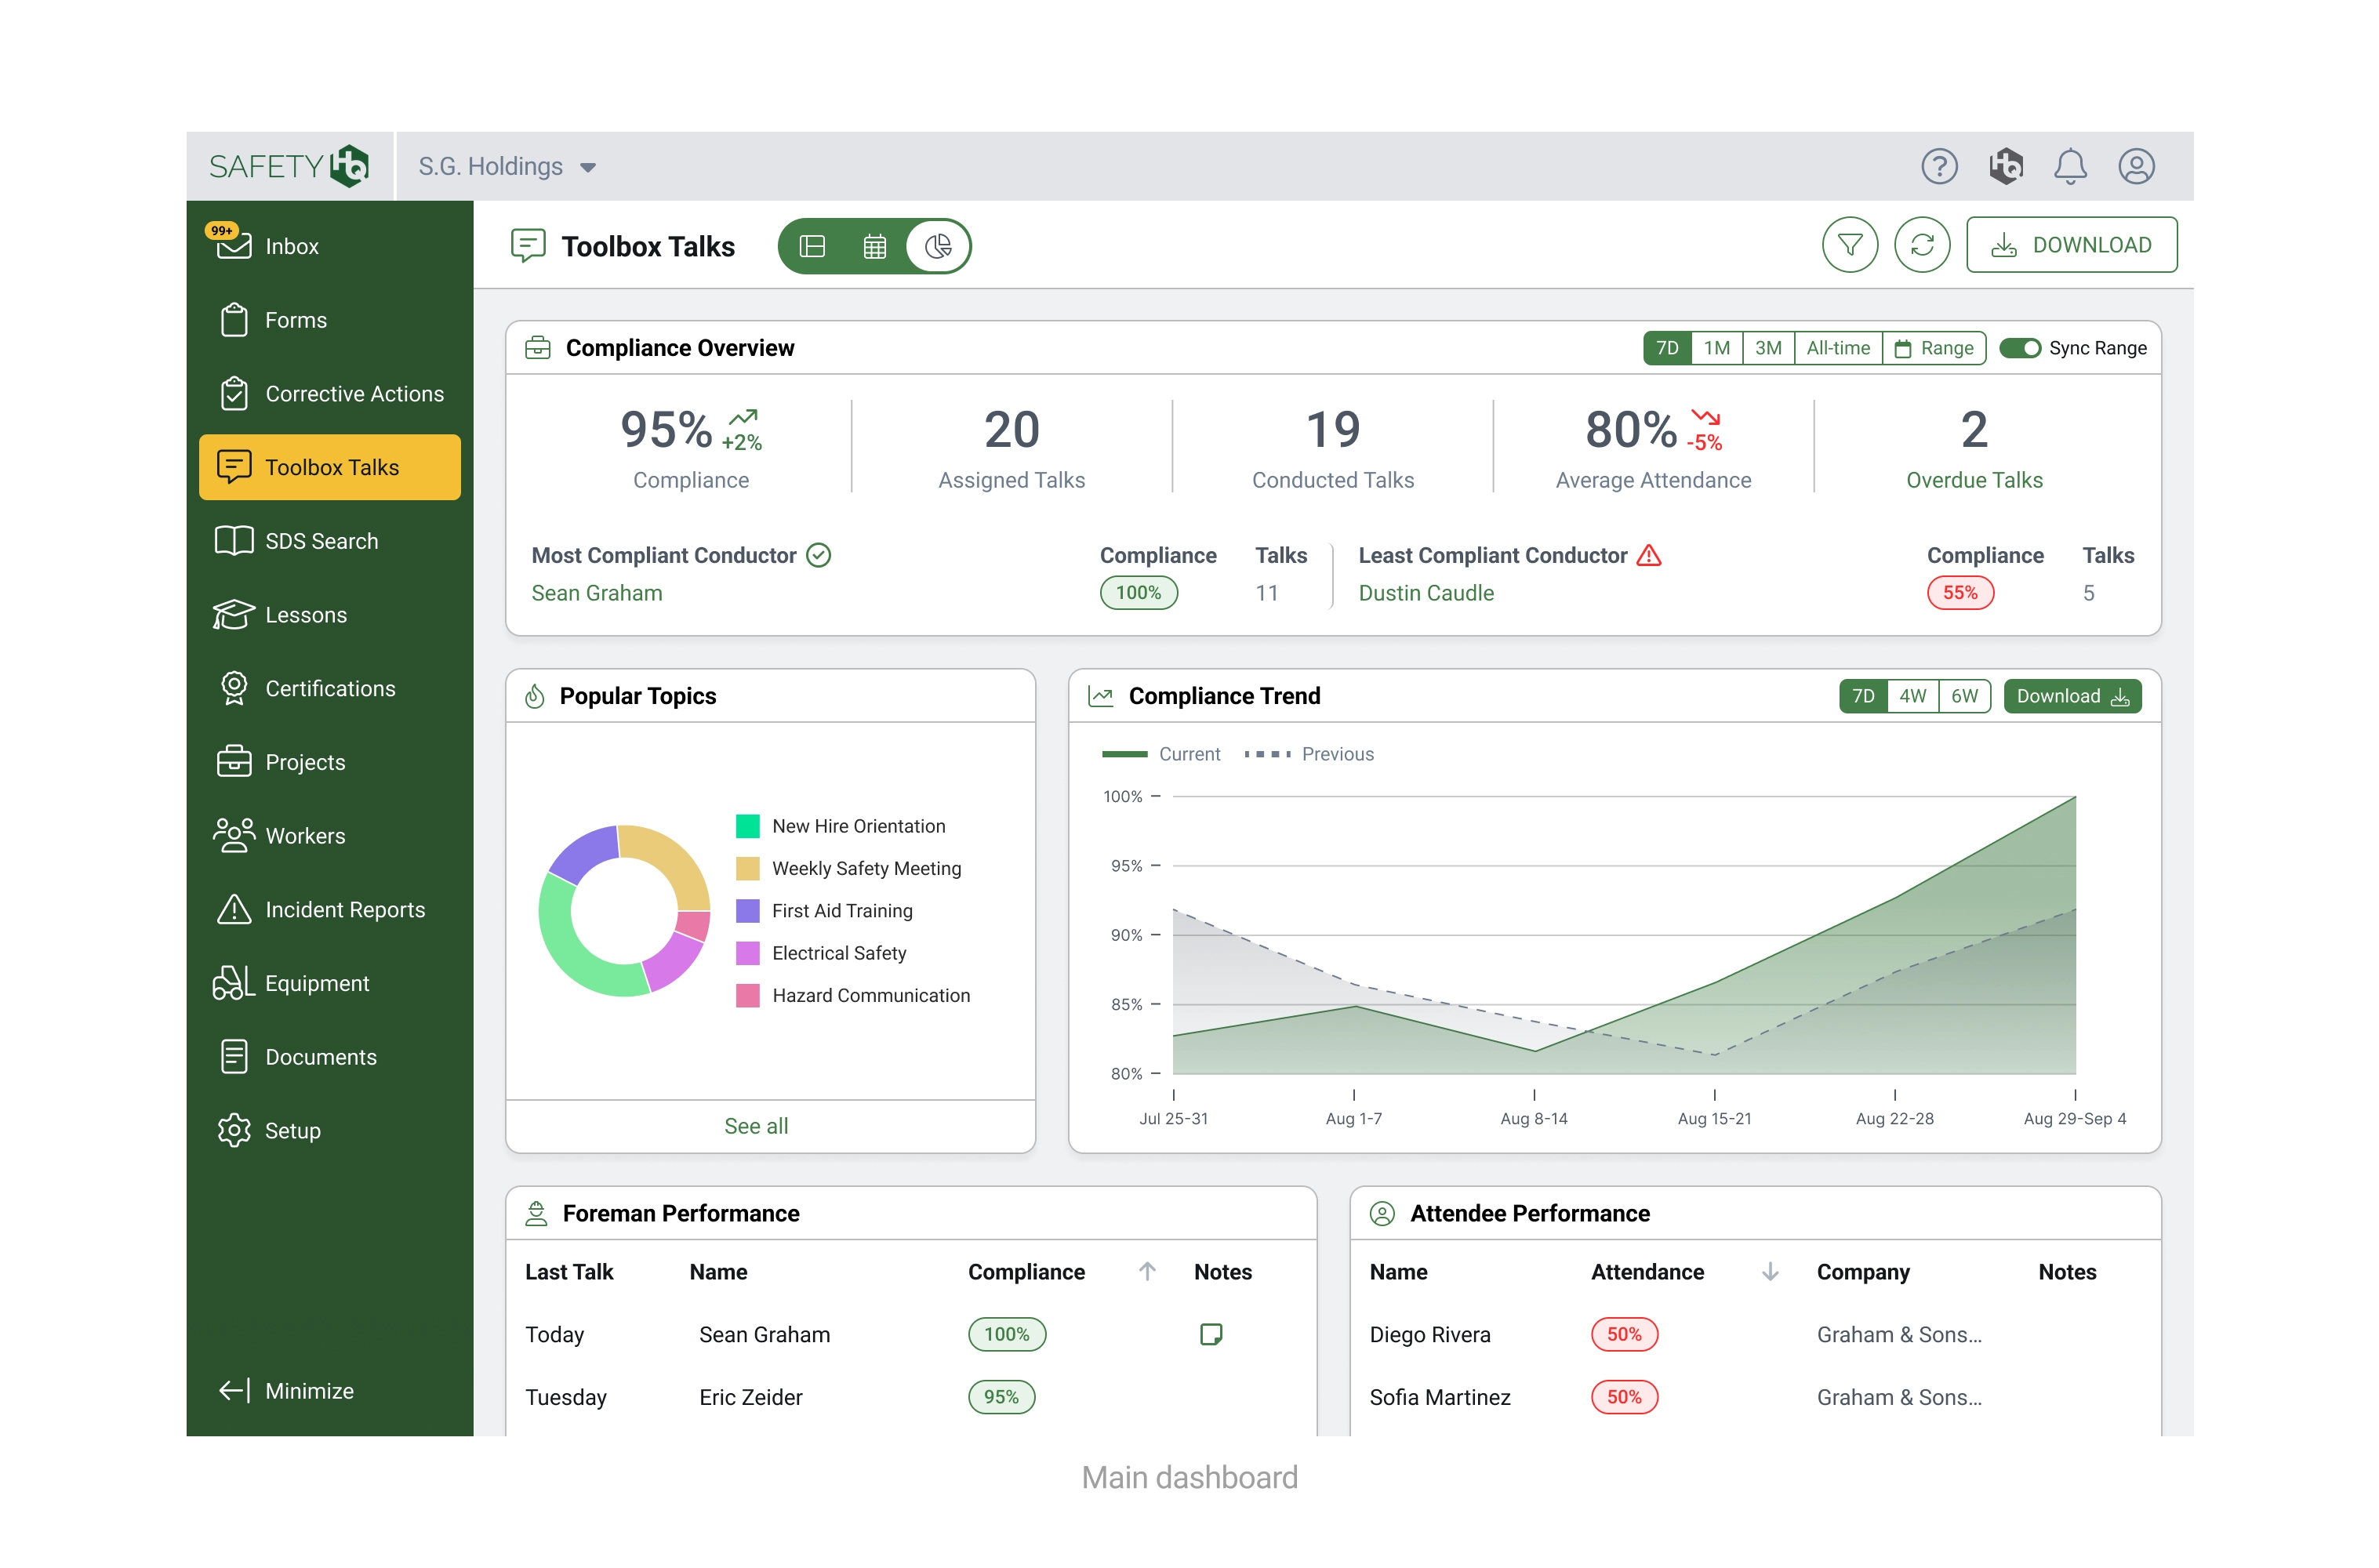
I designed a robust set of dashboards that reports TBT compliance for foremen and workers
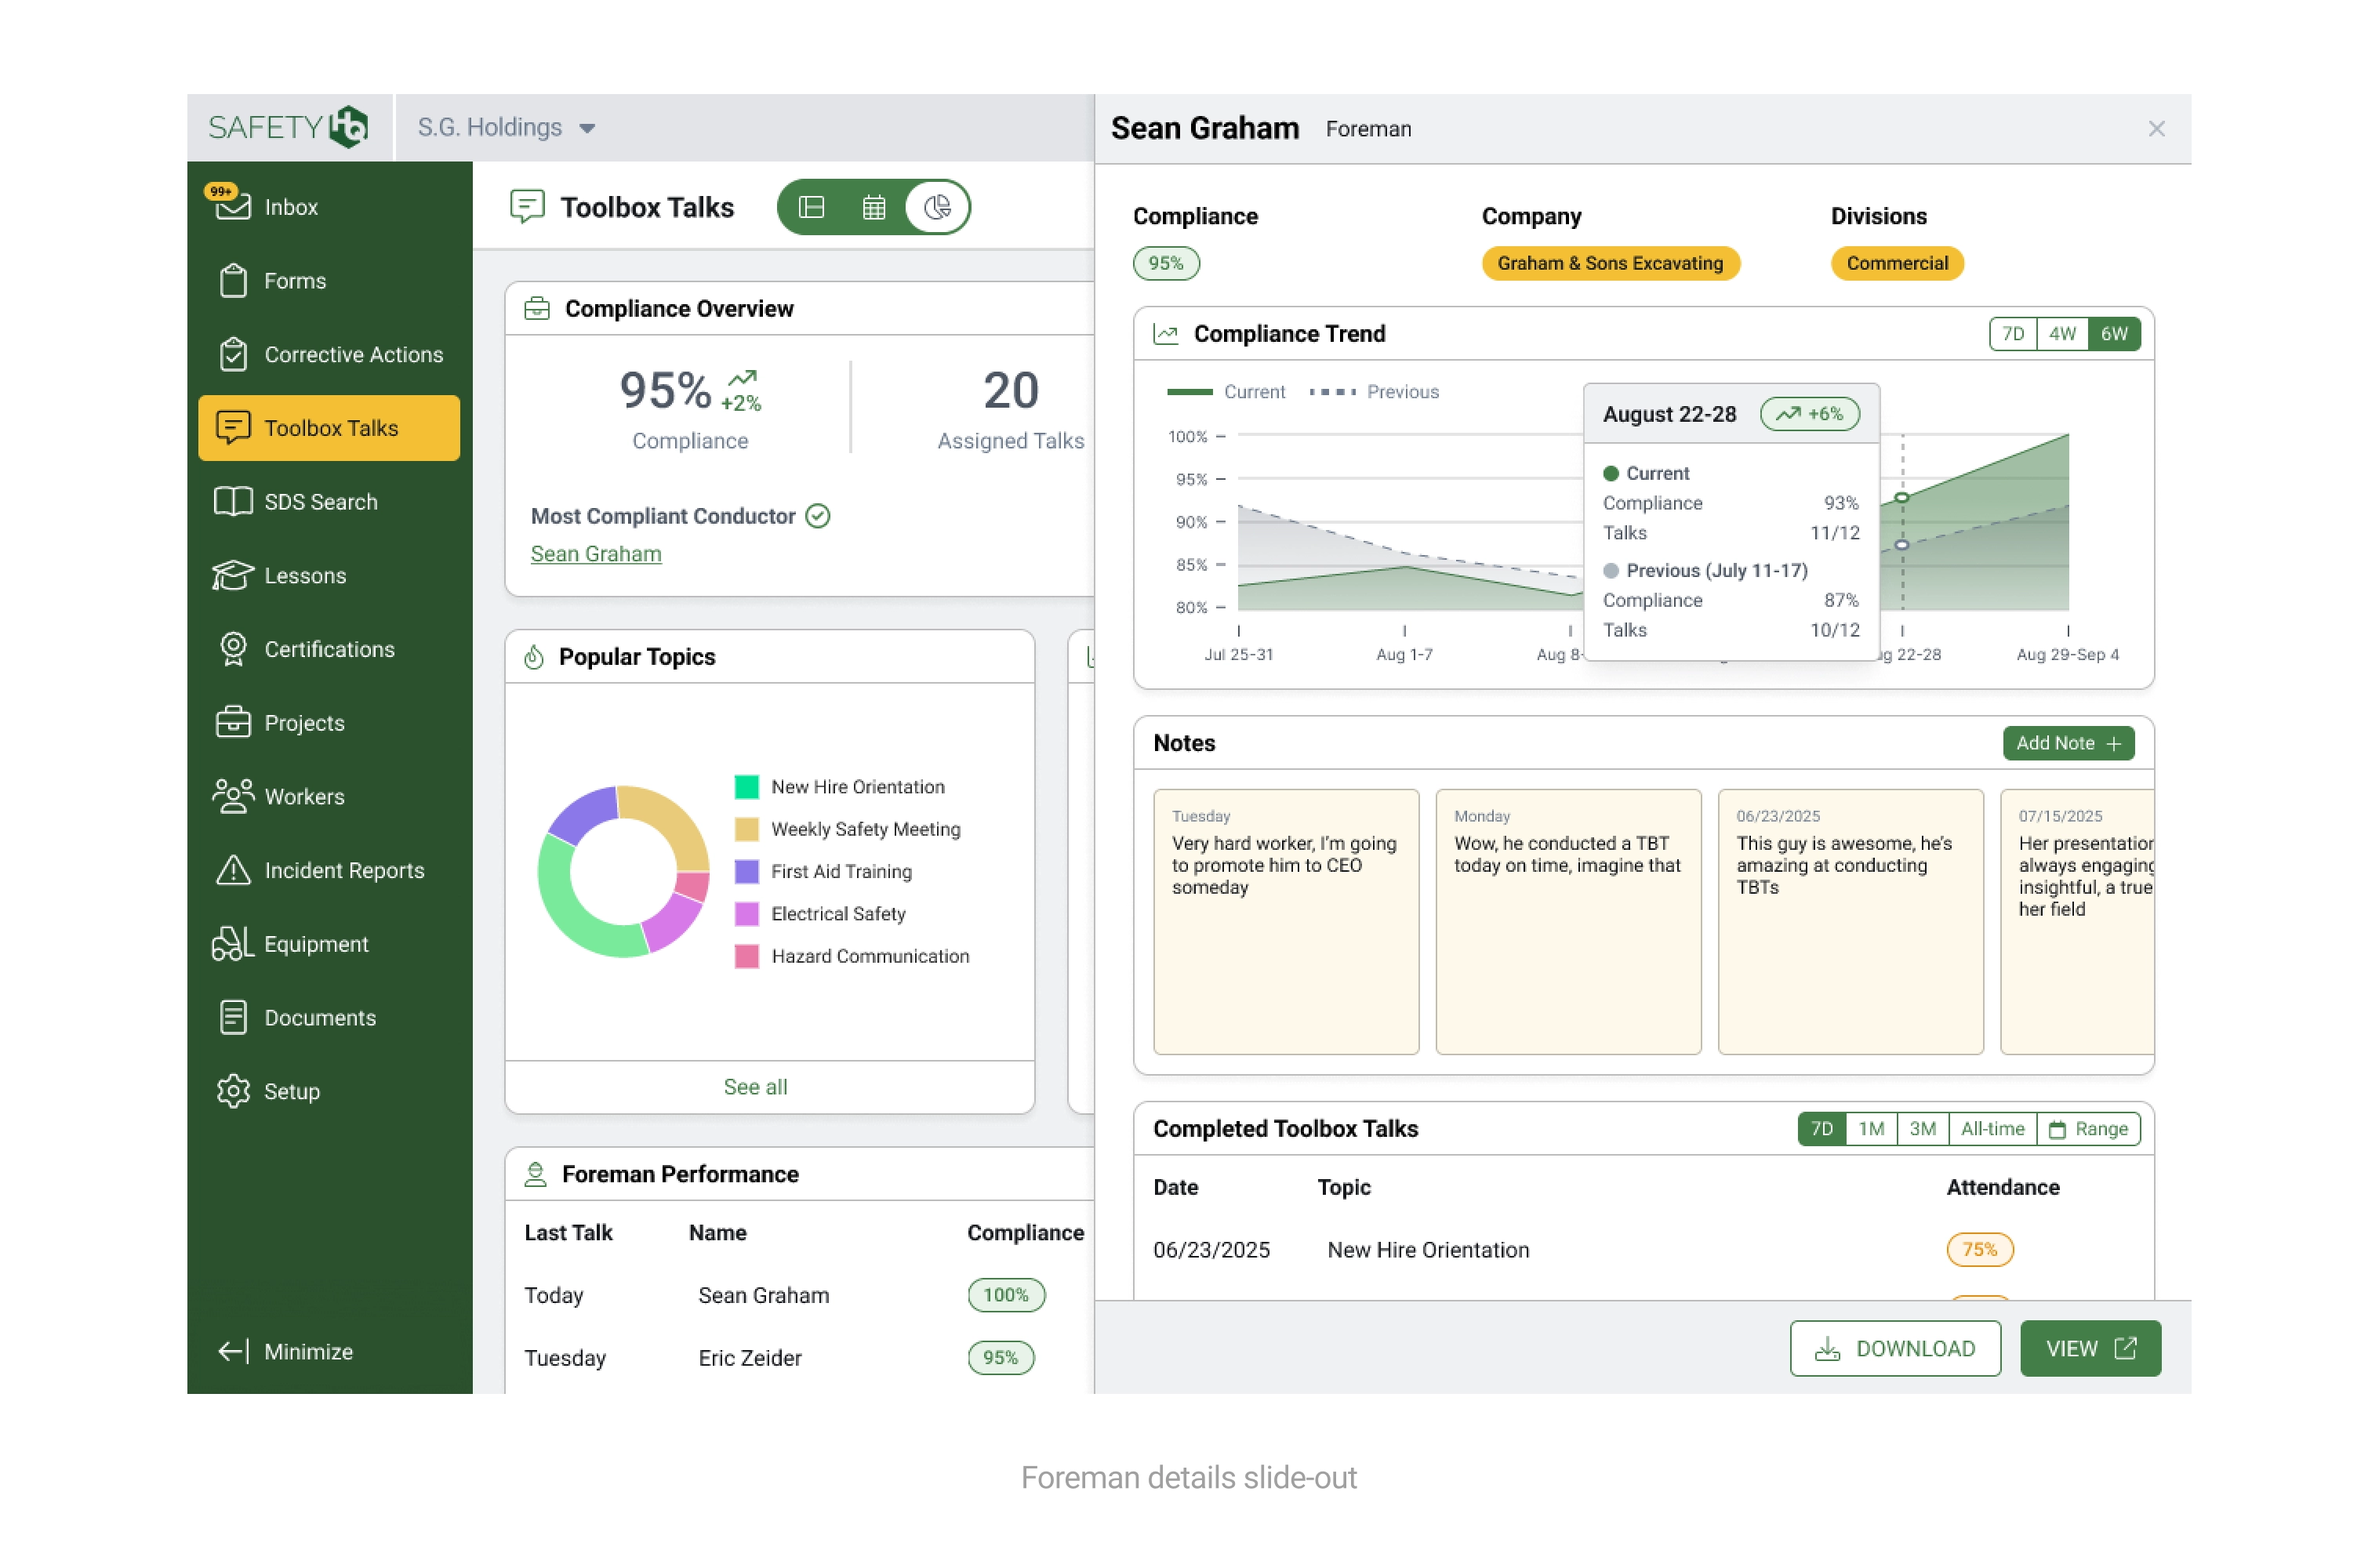
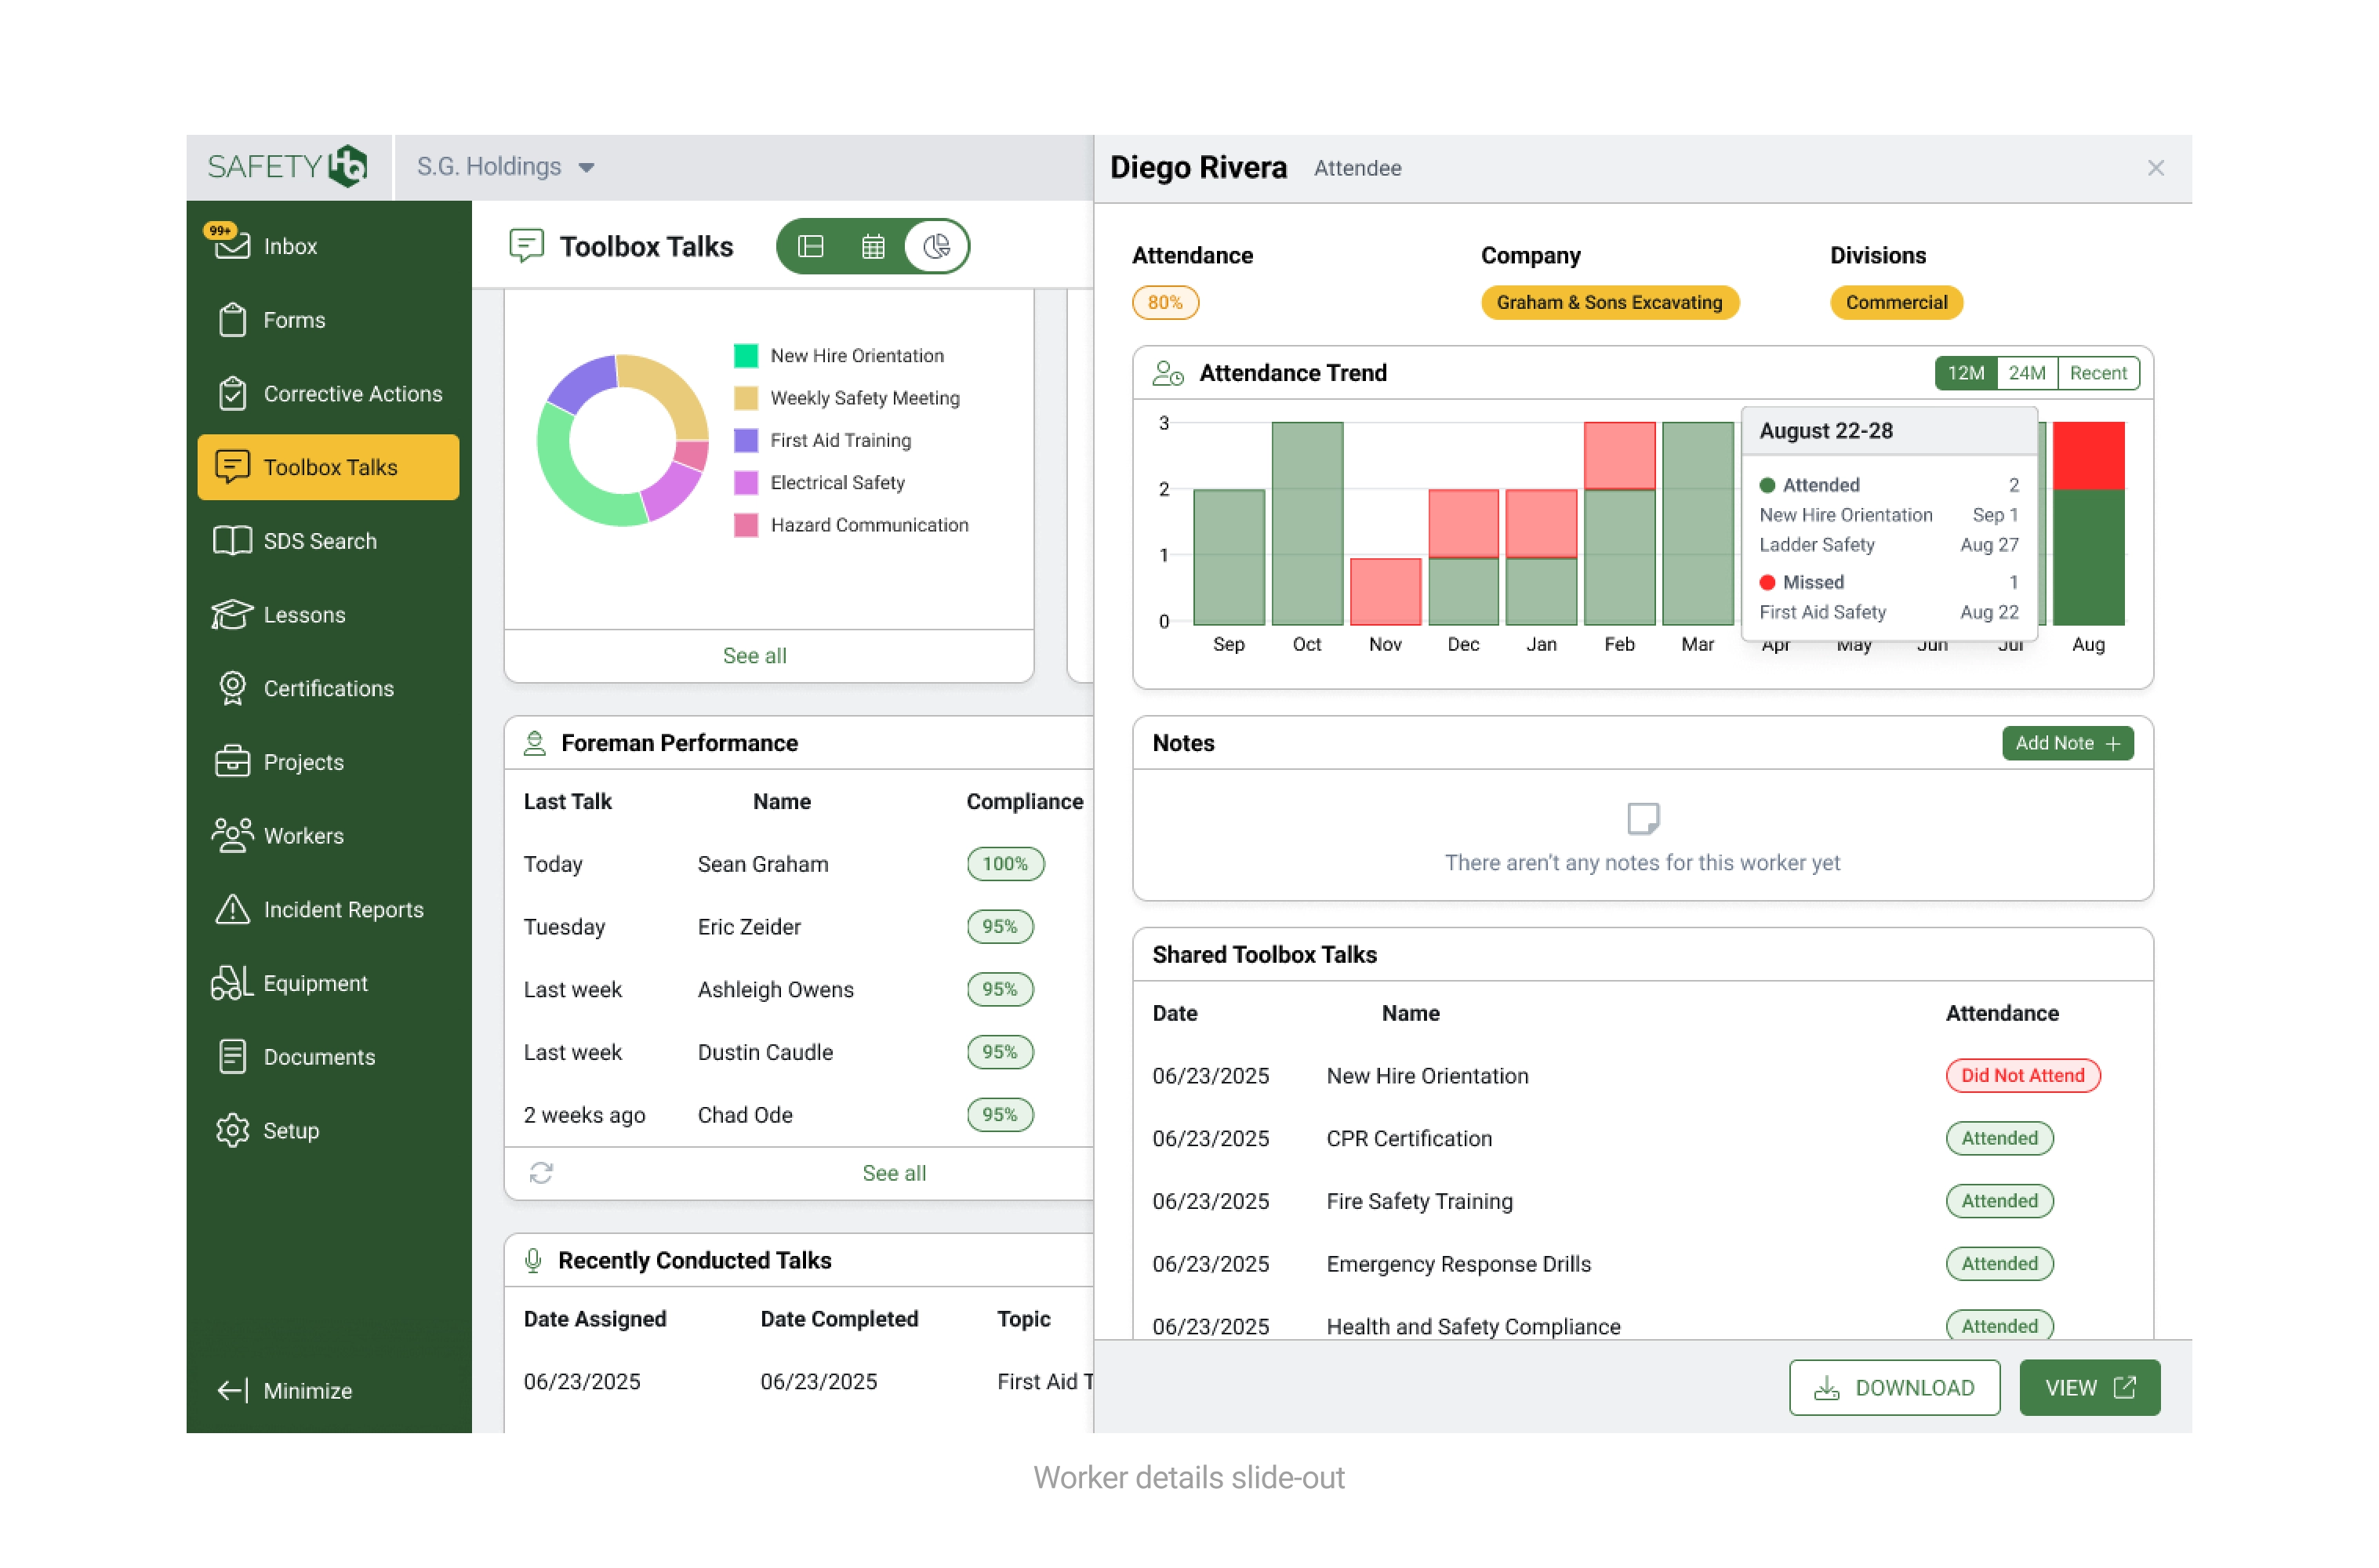
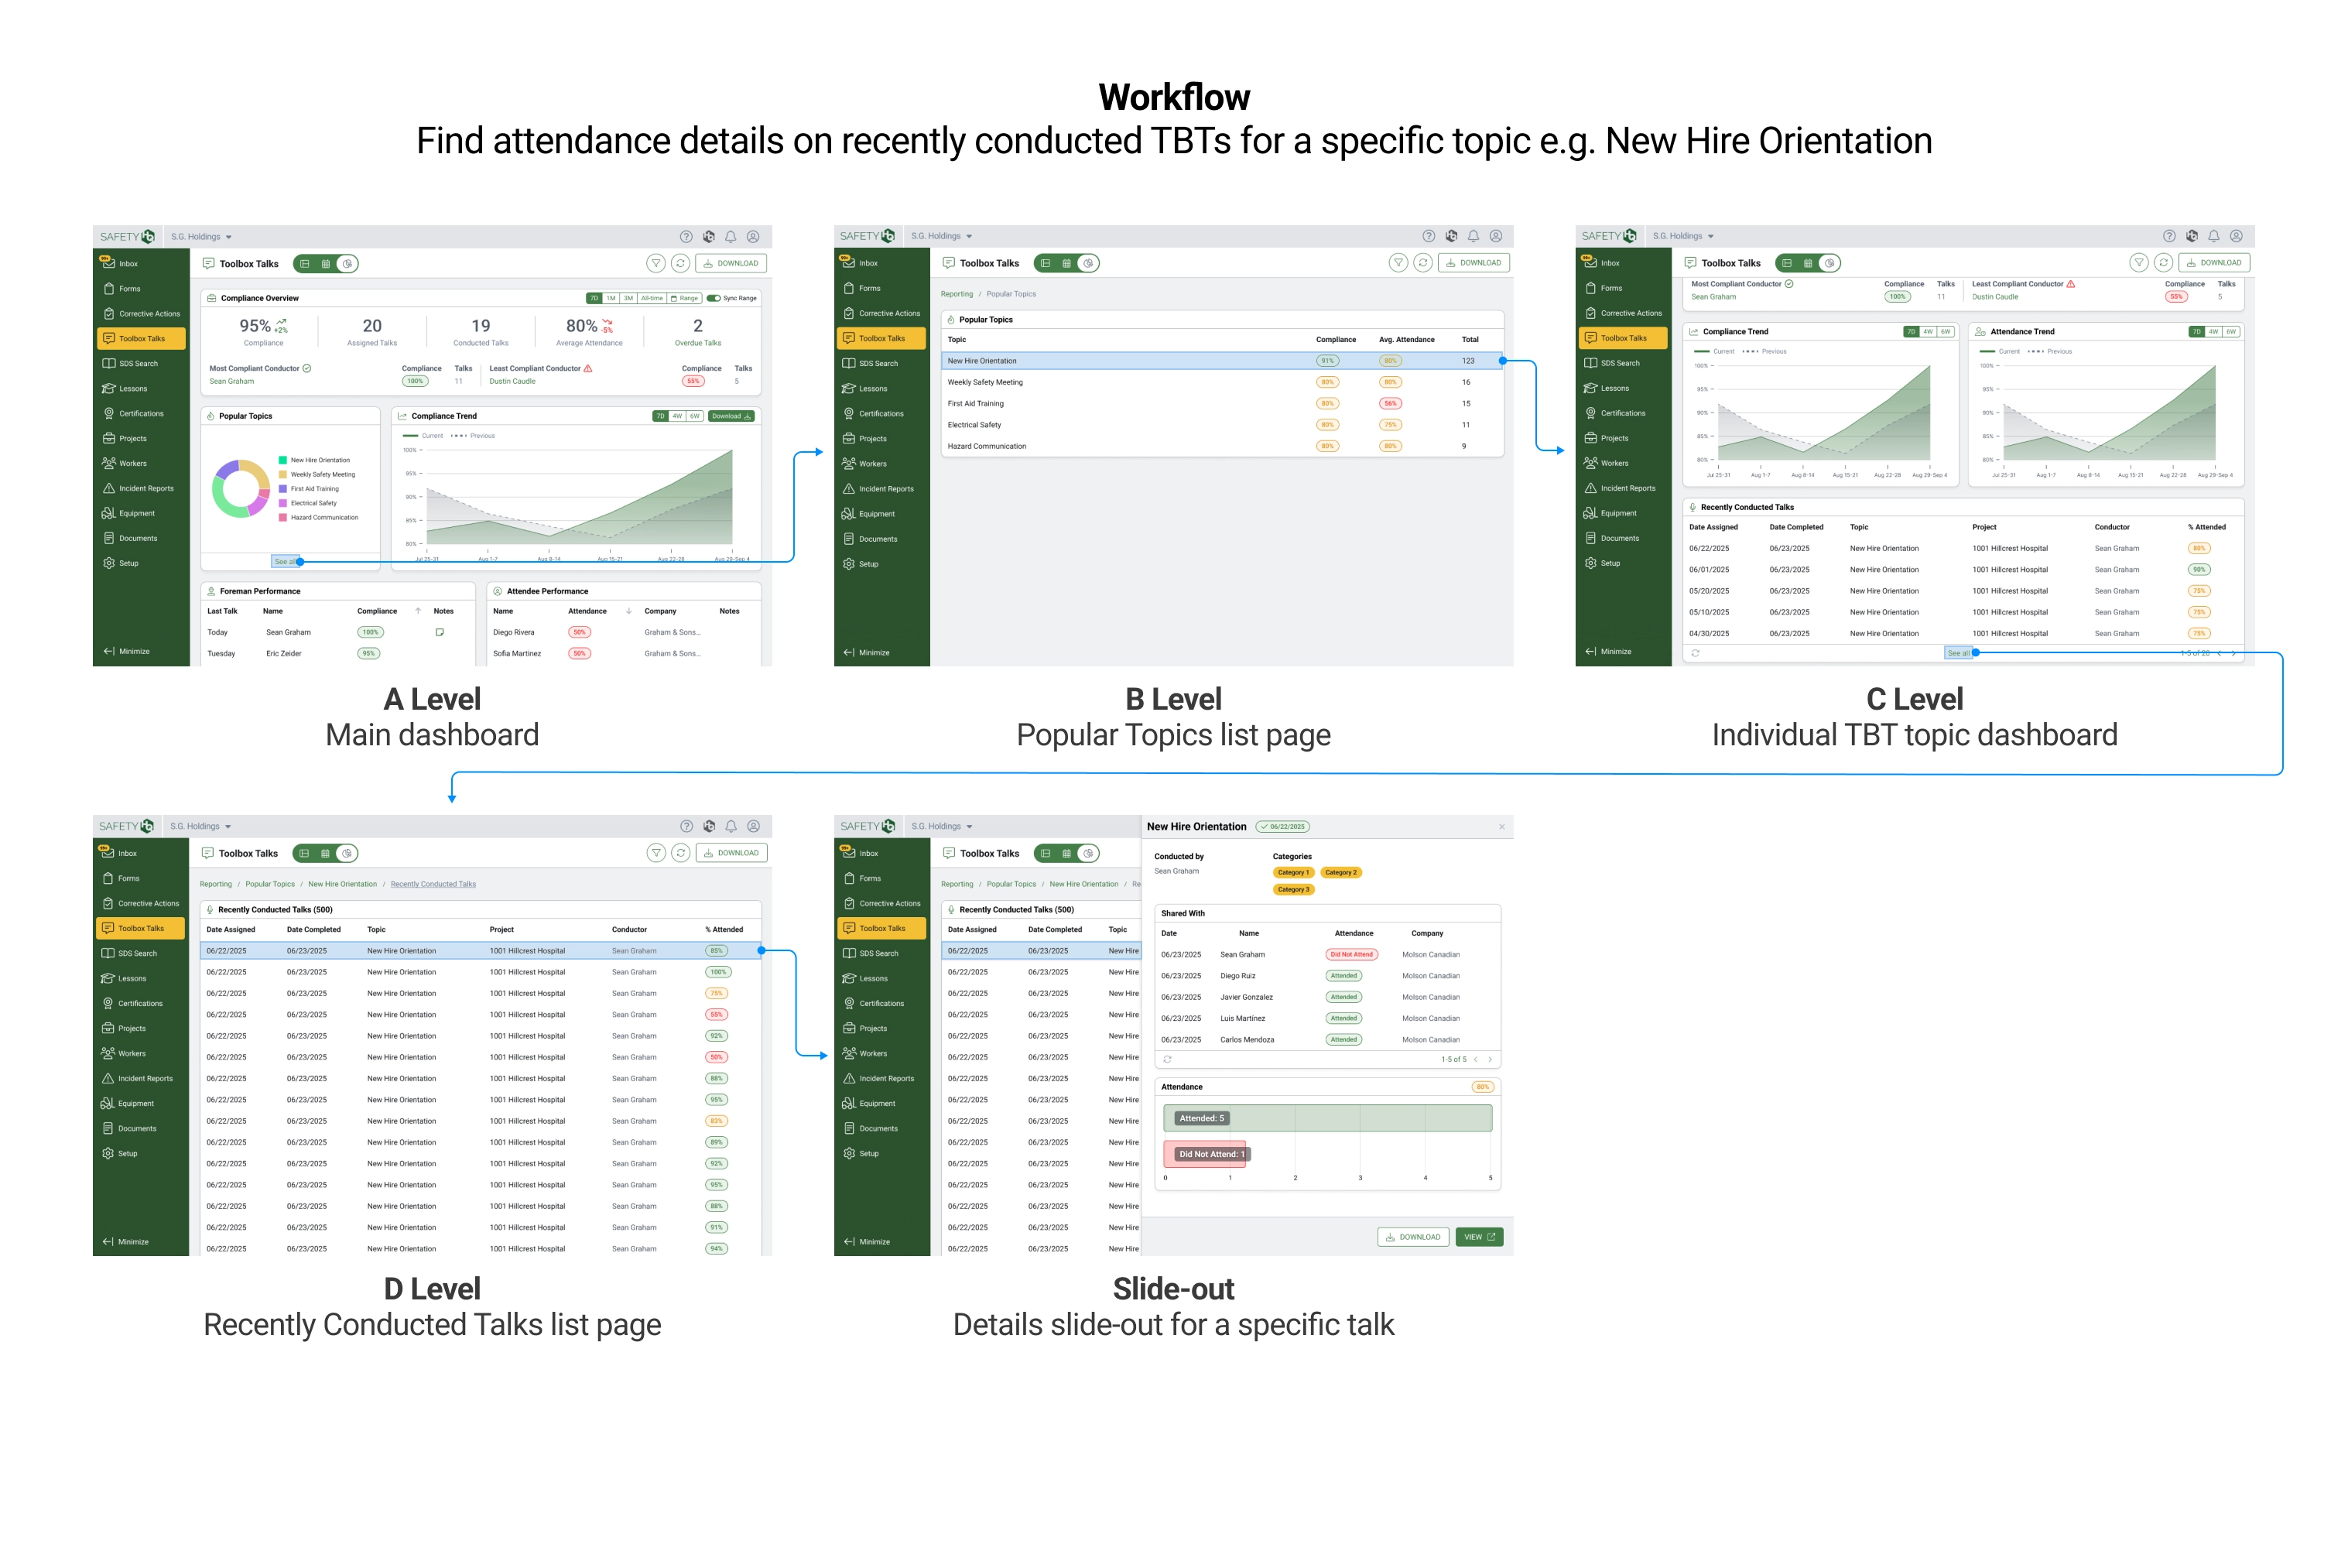
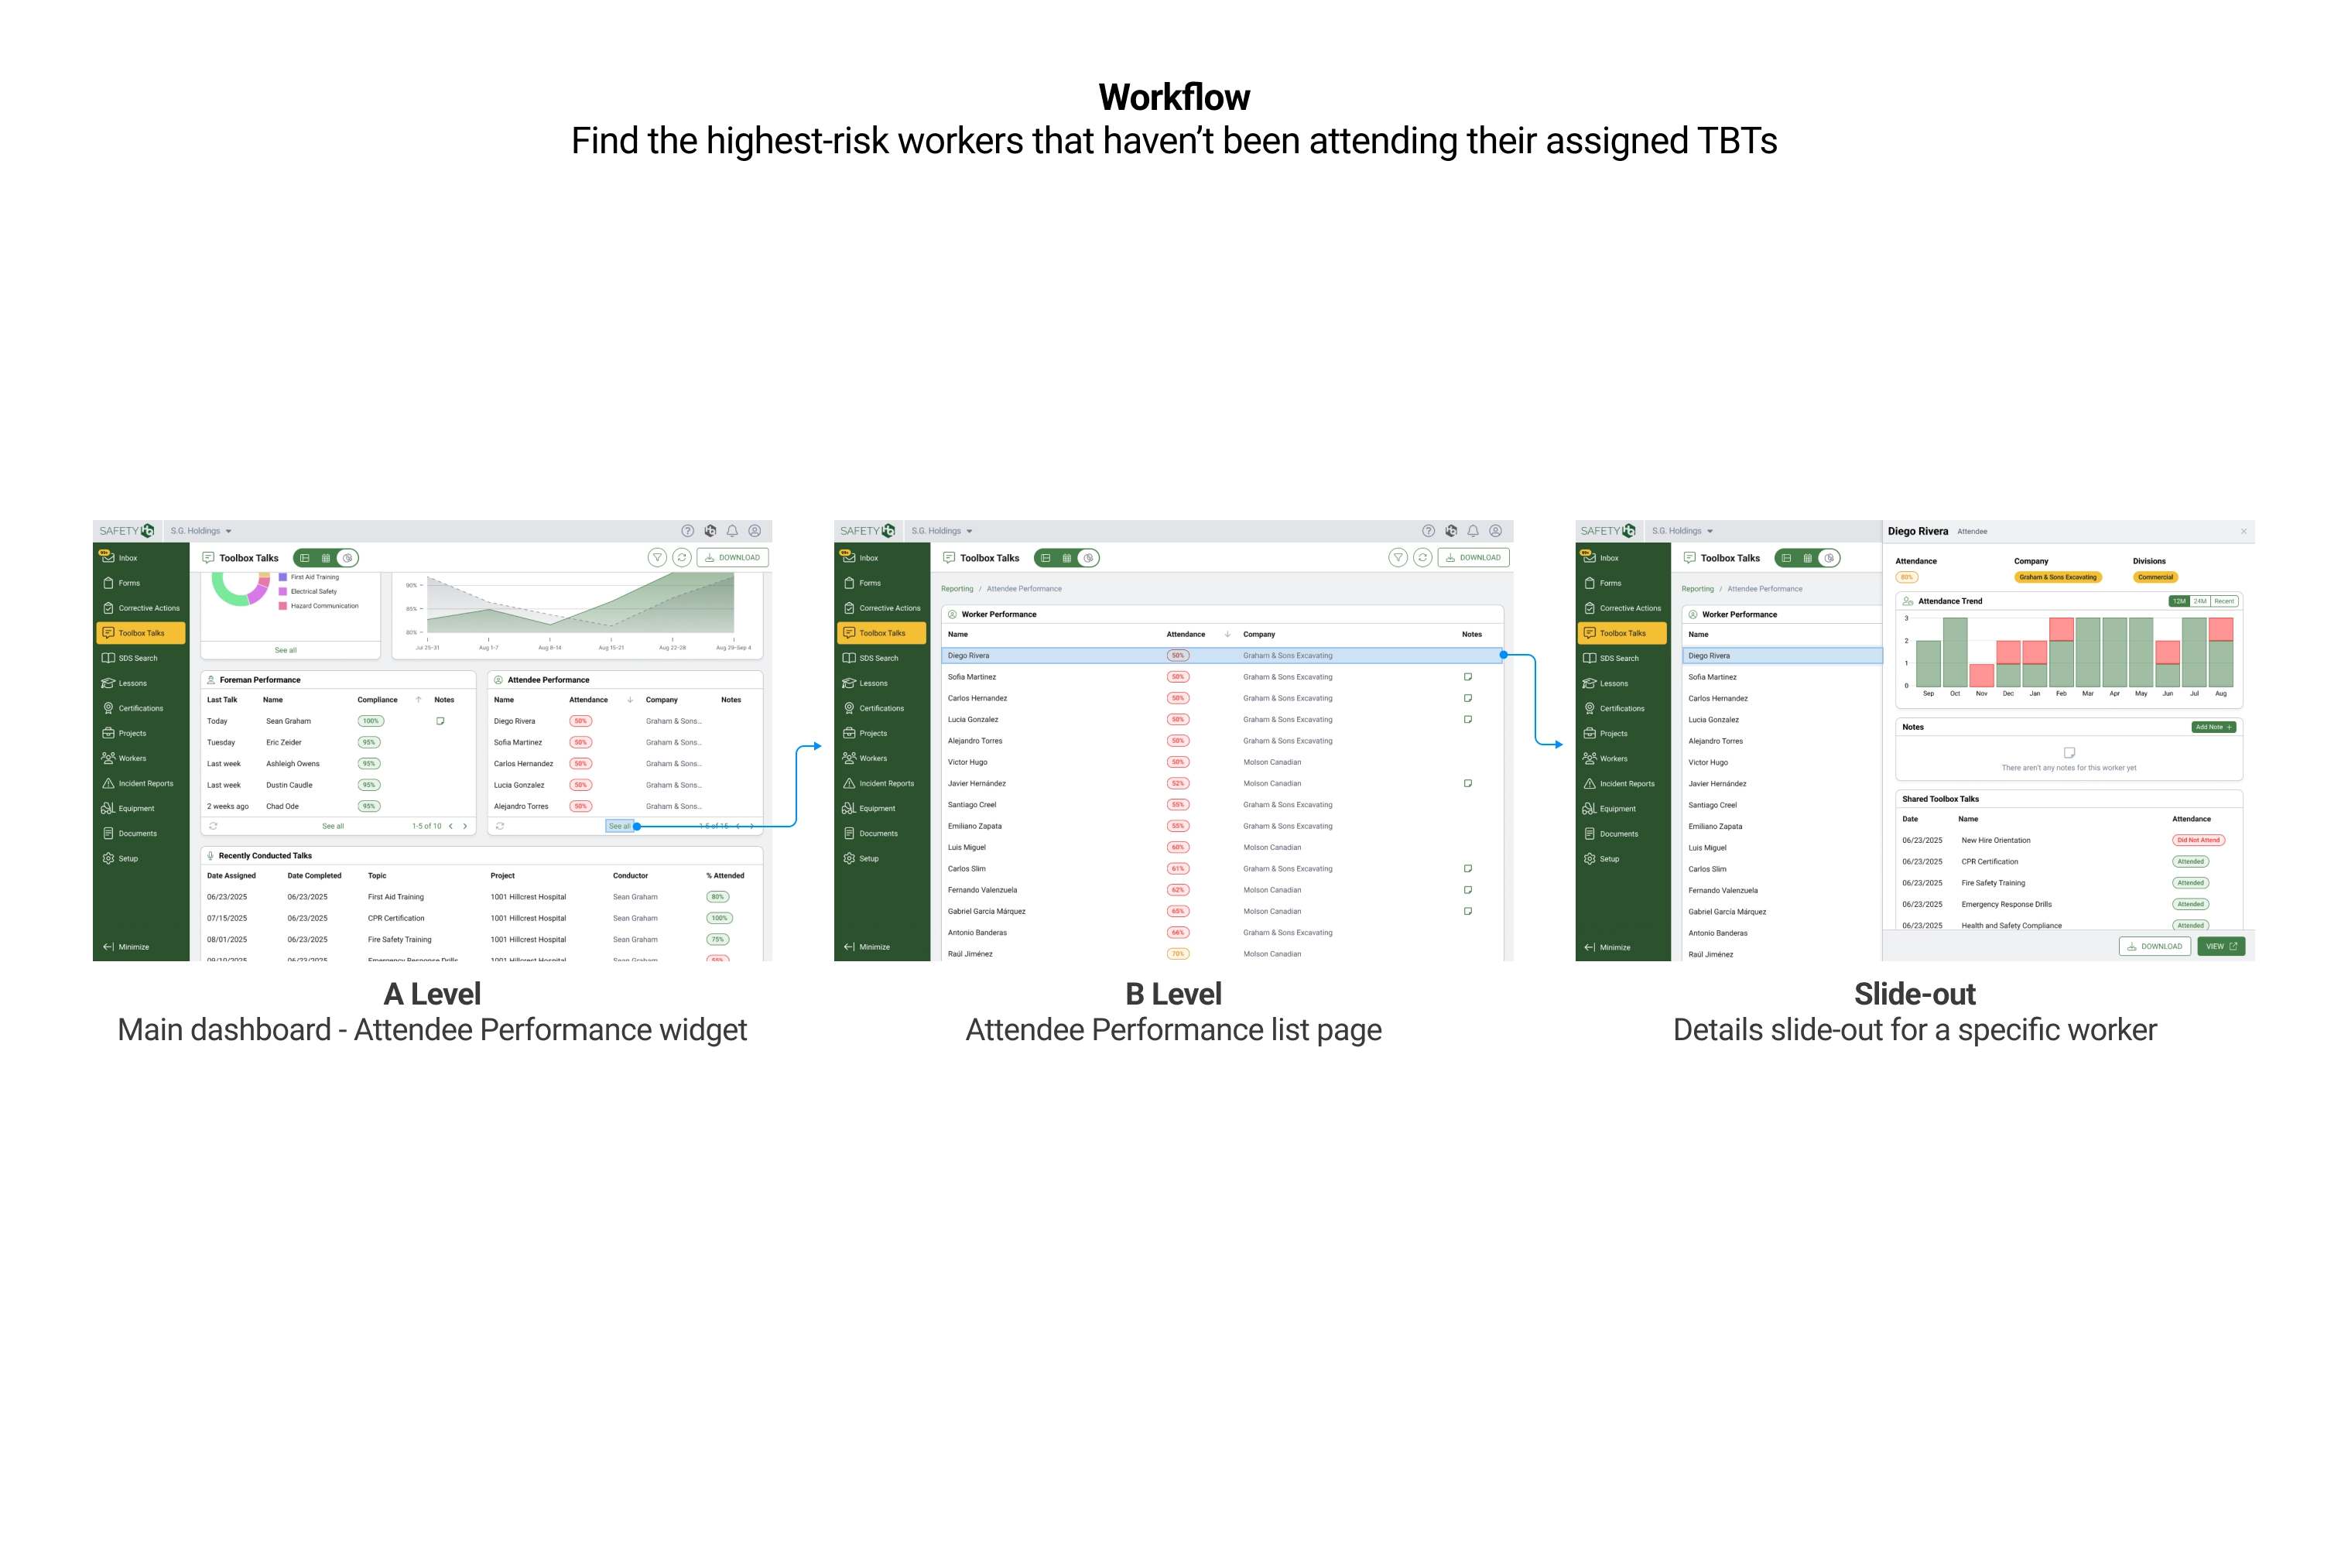
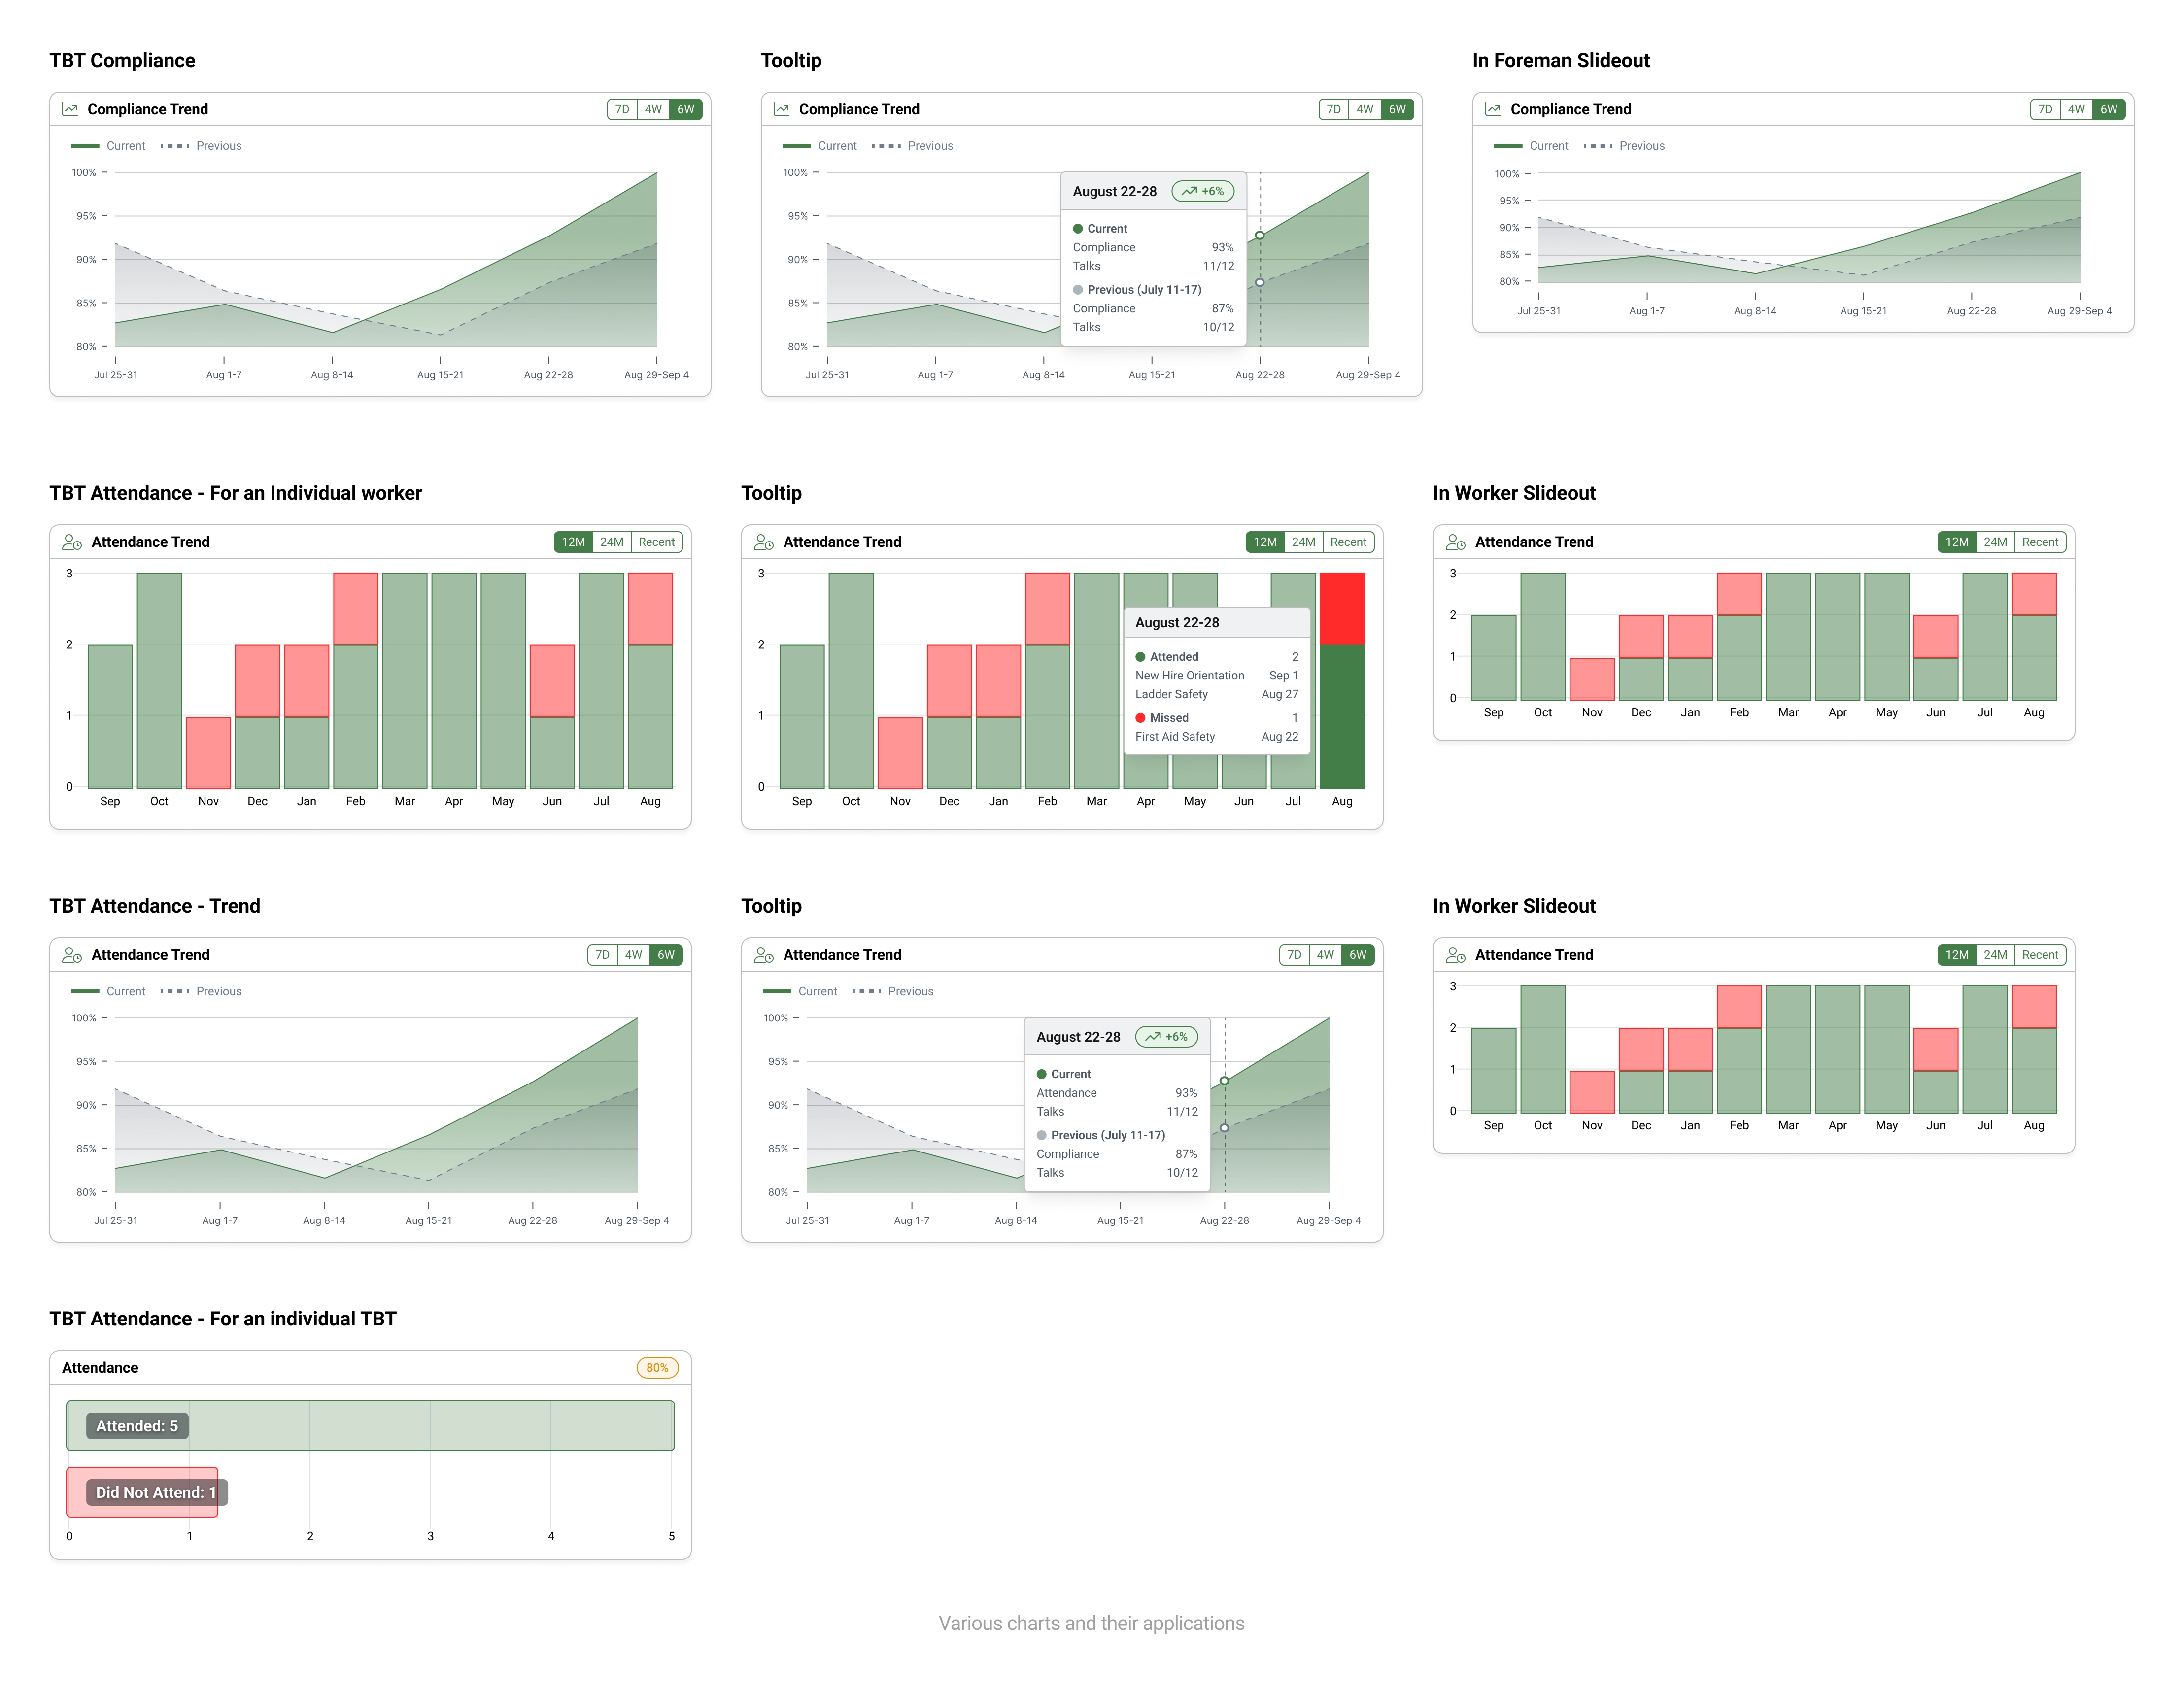
Safety managers have the ability to see from a 30,000ft view where the company's at with TBT compliance. They can also dig deeper to see data on high-risk or very compliant individuals, or trends for certain topics.
The UI was built with flexibility in mind, enabling managers to dig into the data for trends on TBT topics, foremen, or workers.
The content structure was carefully curated to their priorities, defined by SMEs and industry research;
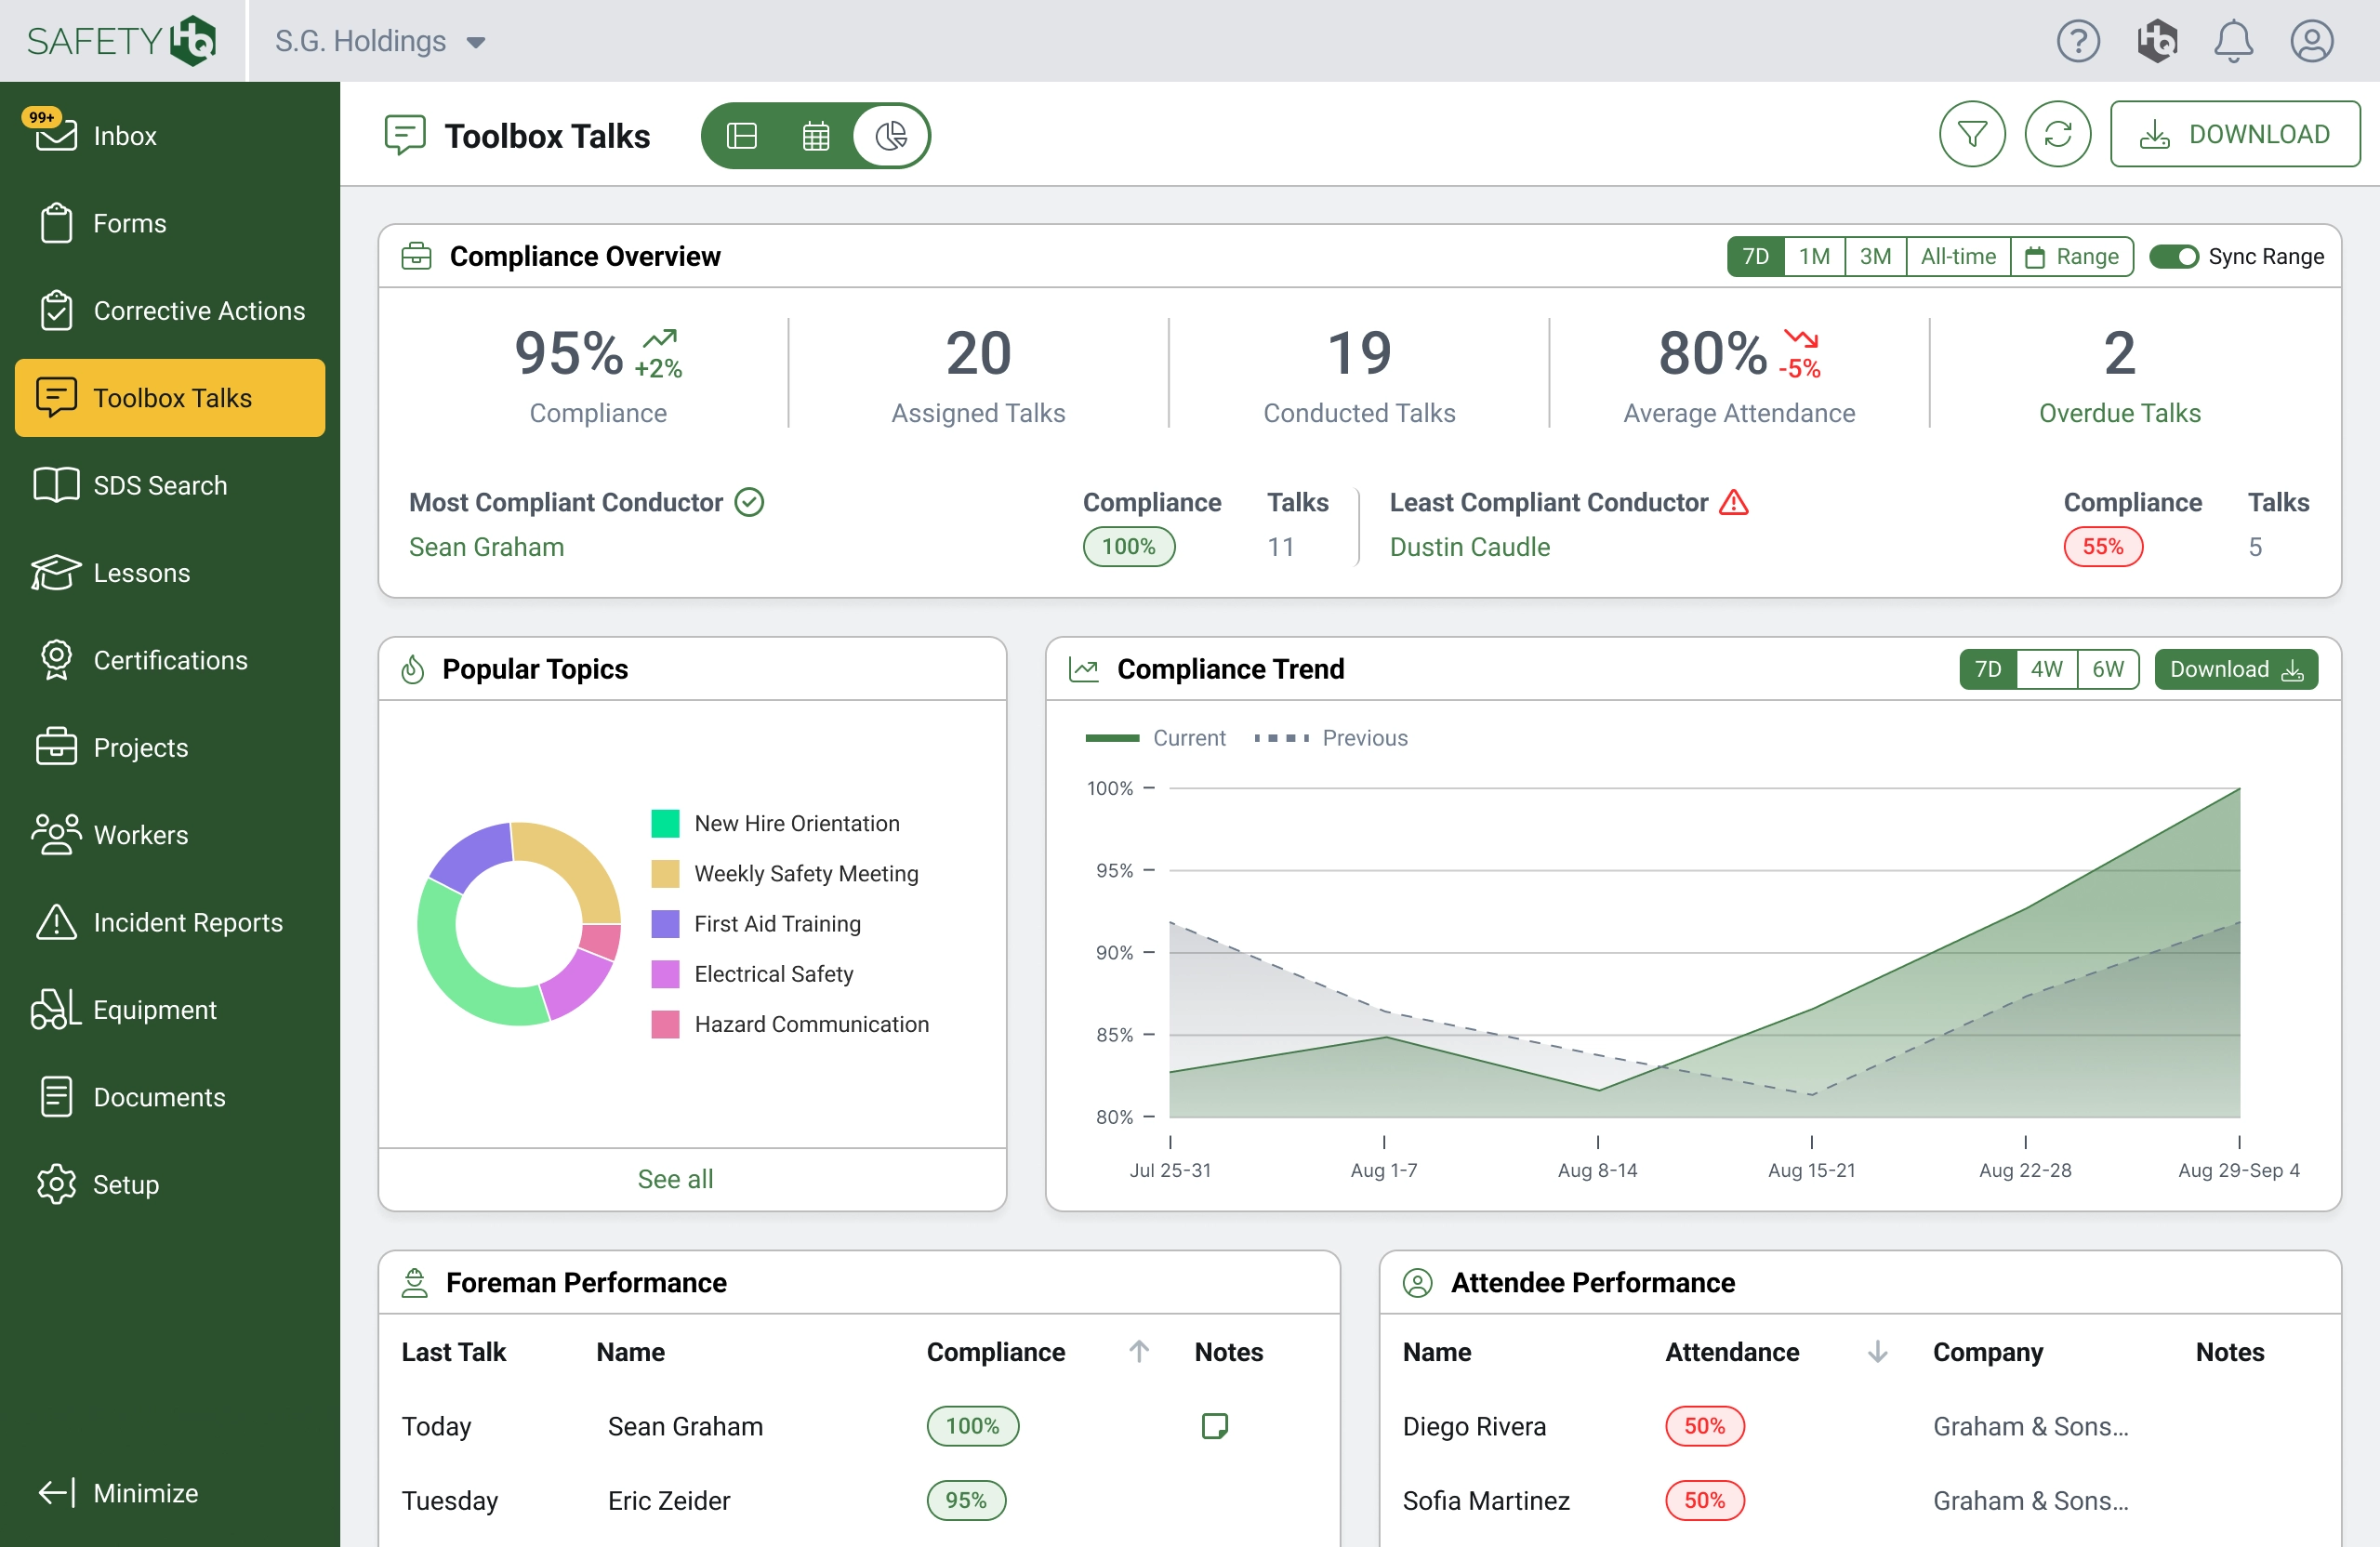
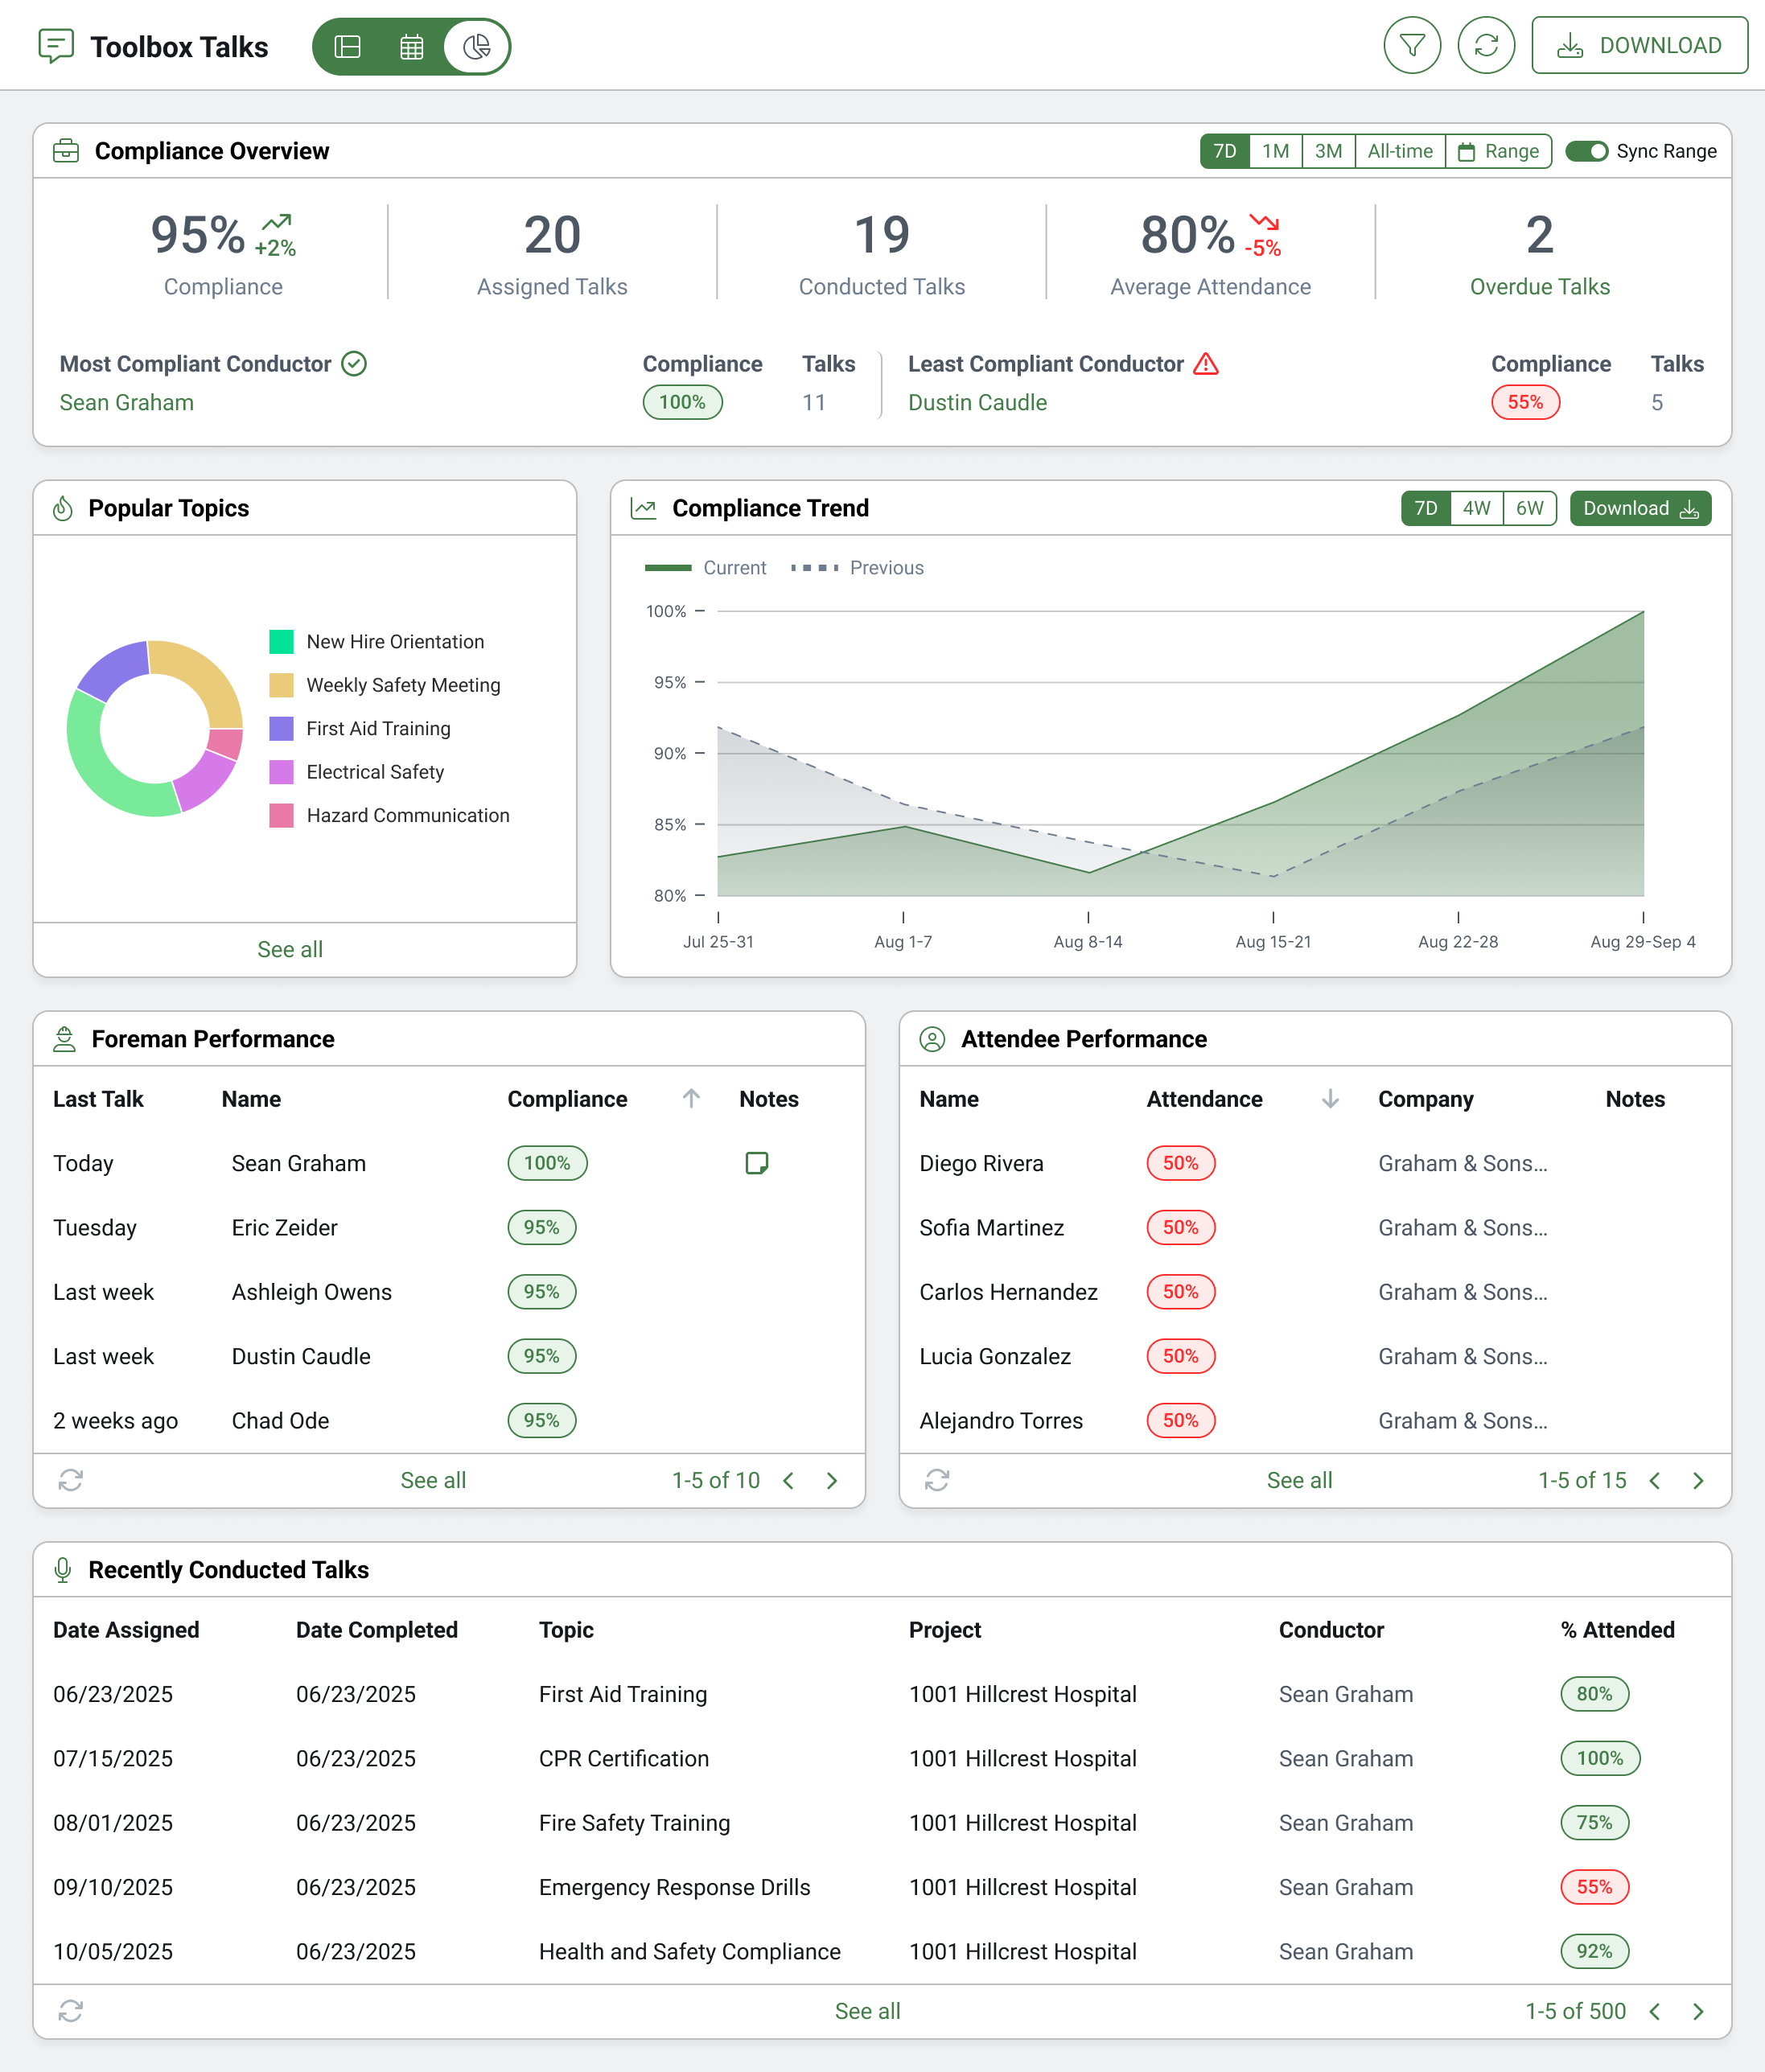
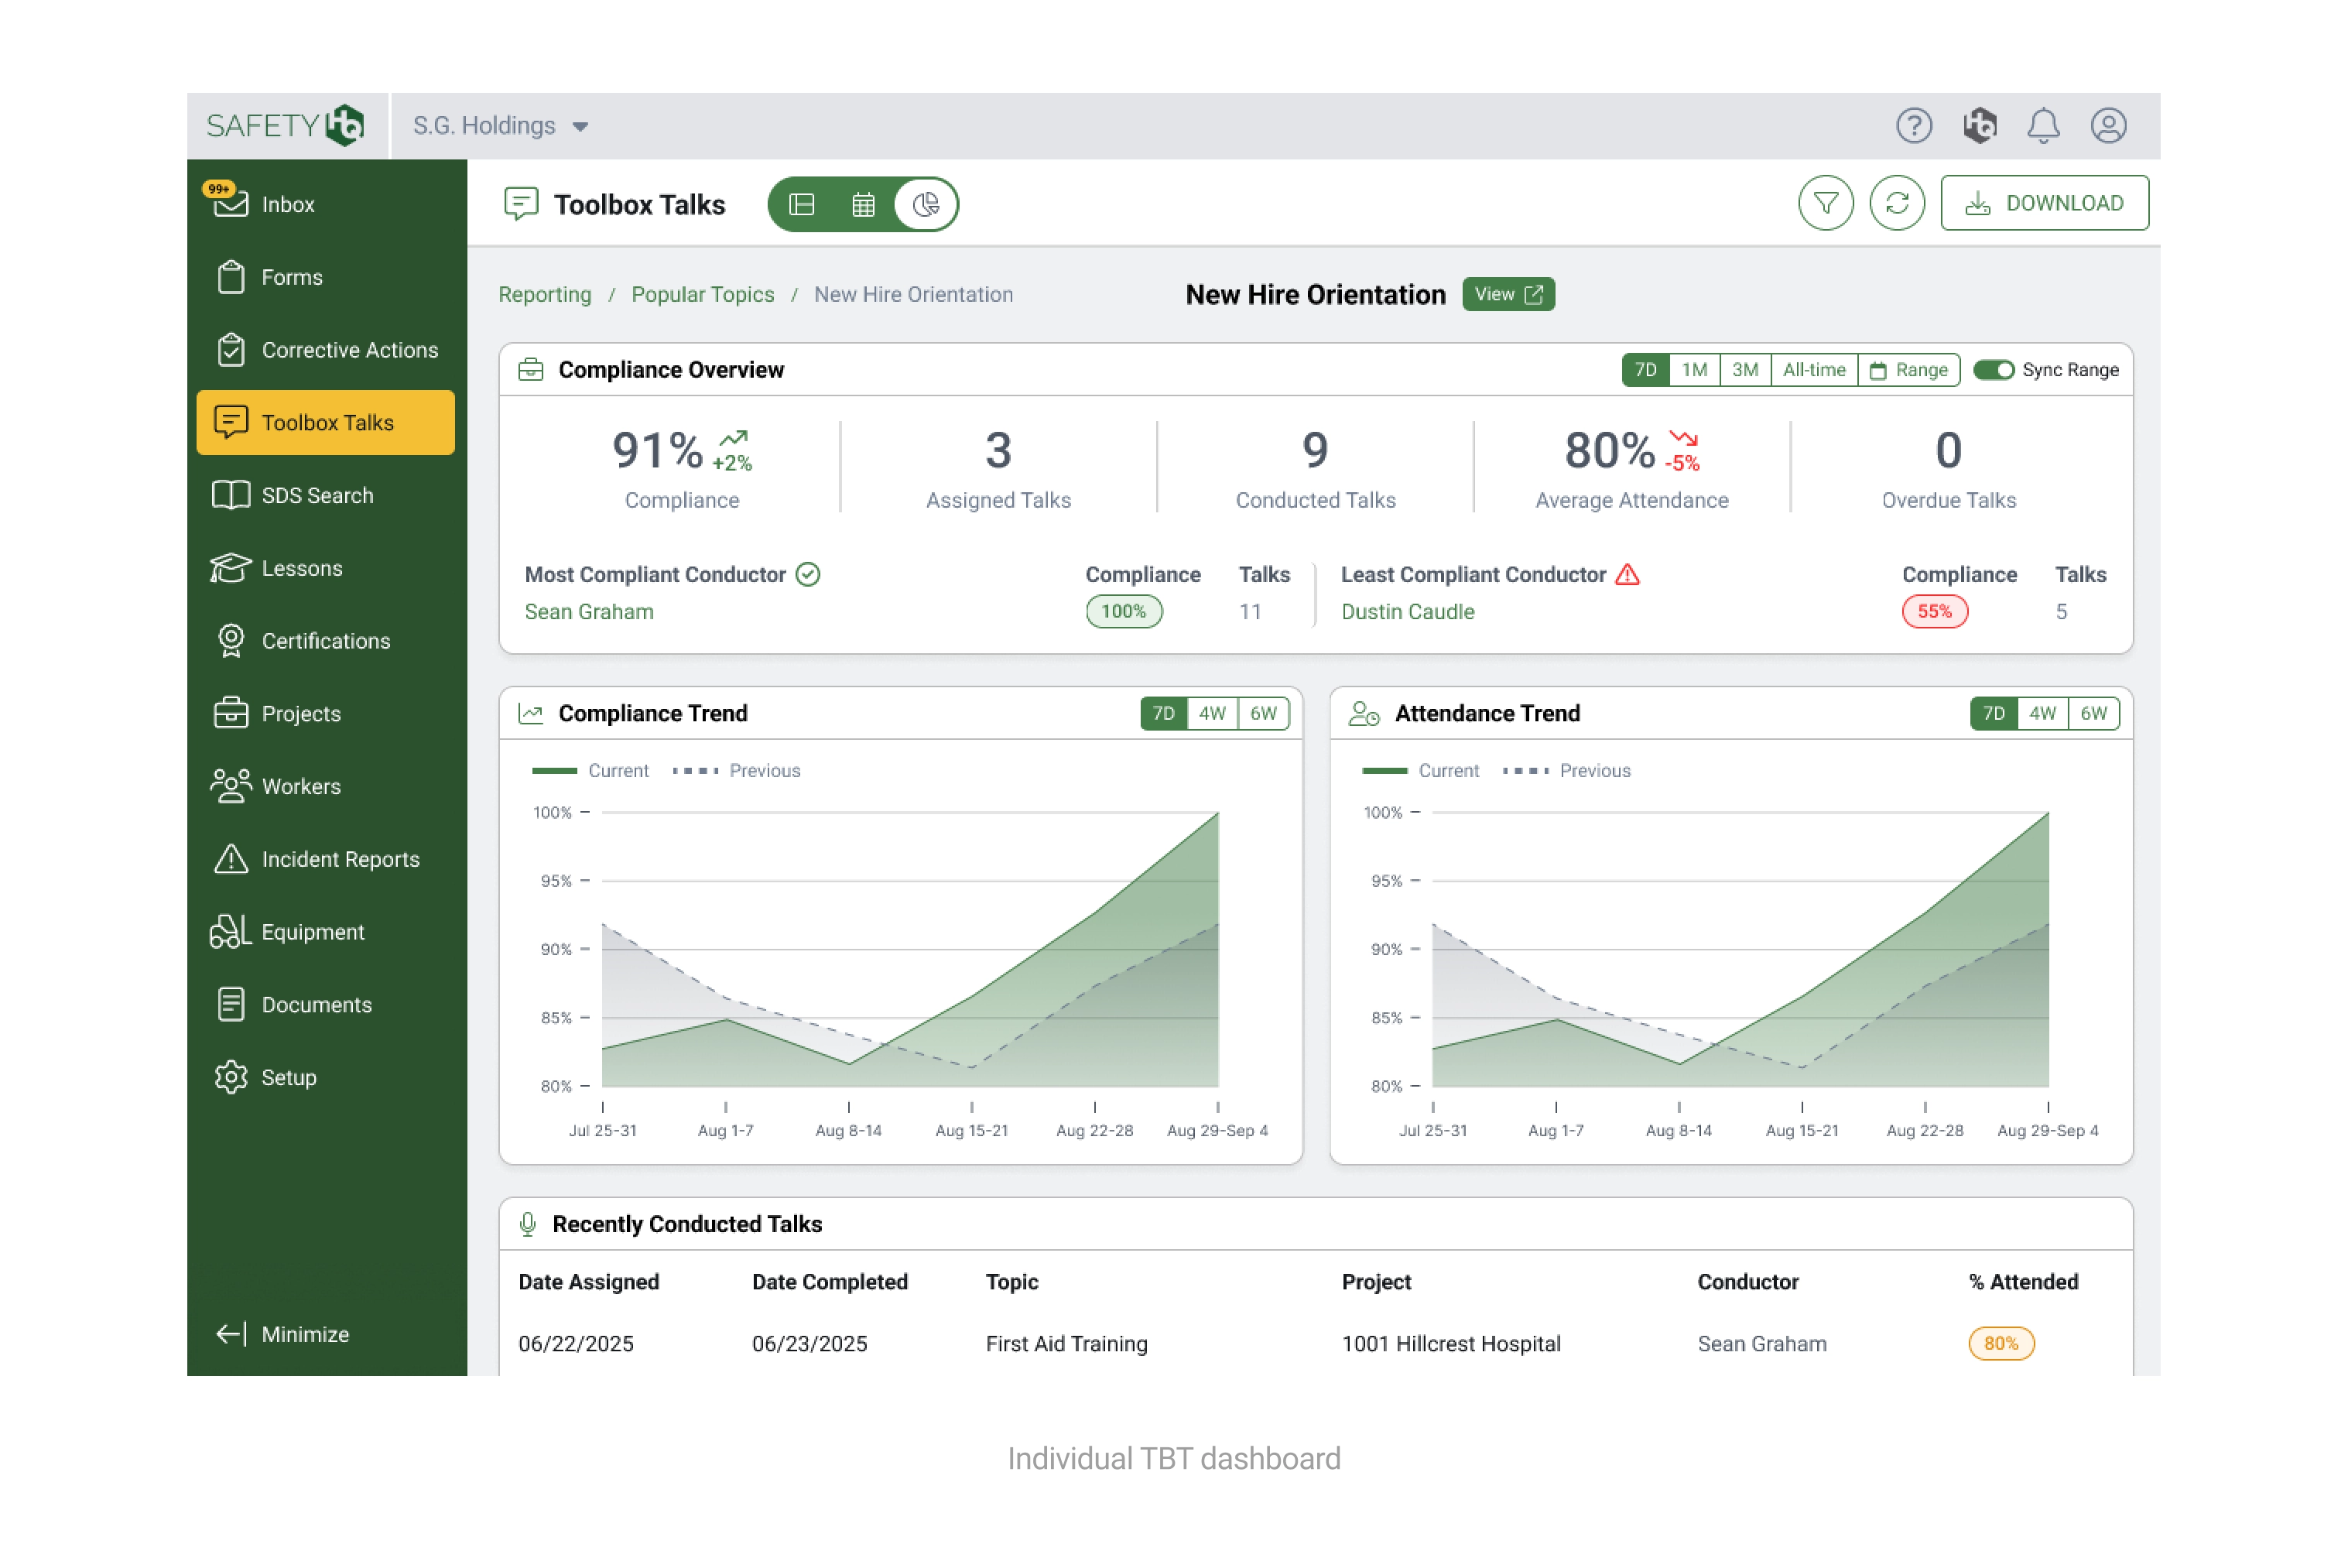
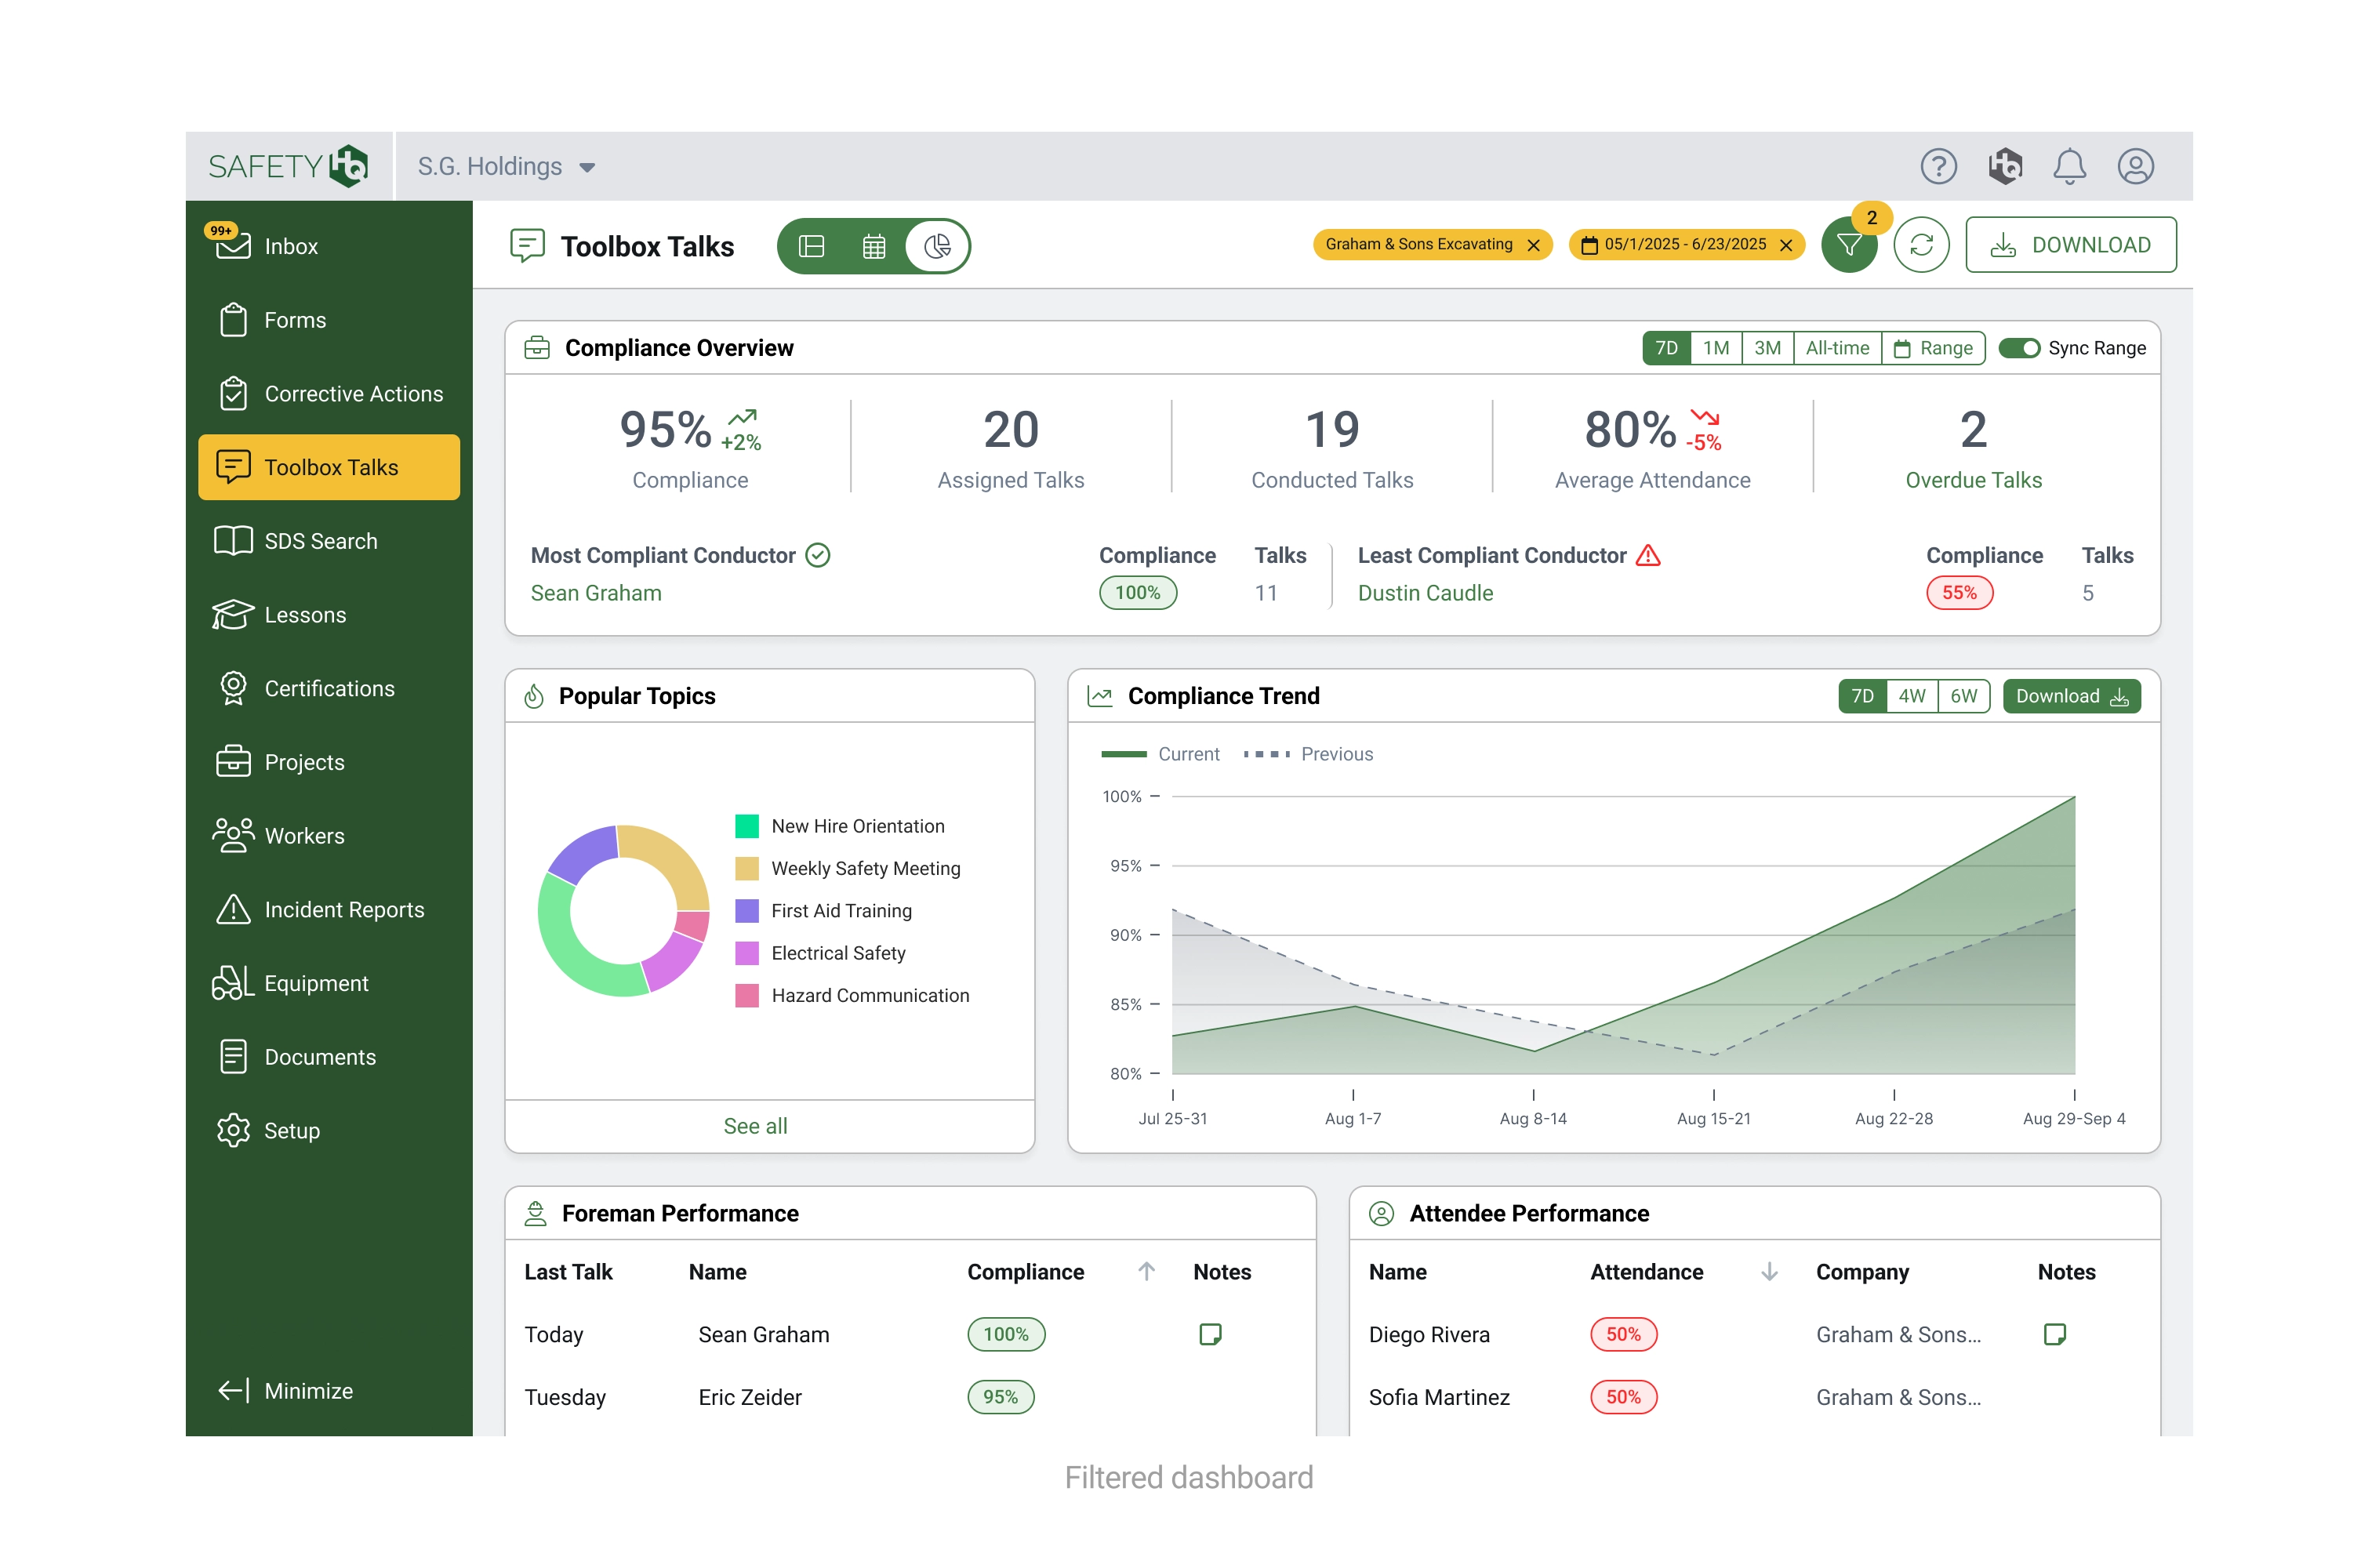
- Compliance overview (percentages on assigned TBTs conducted and attended, overdue talks, and currently assigned/conducted TBTs)
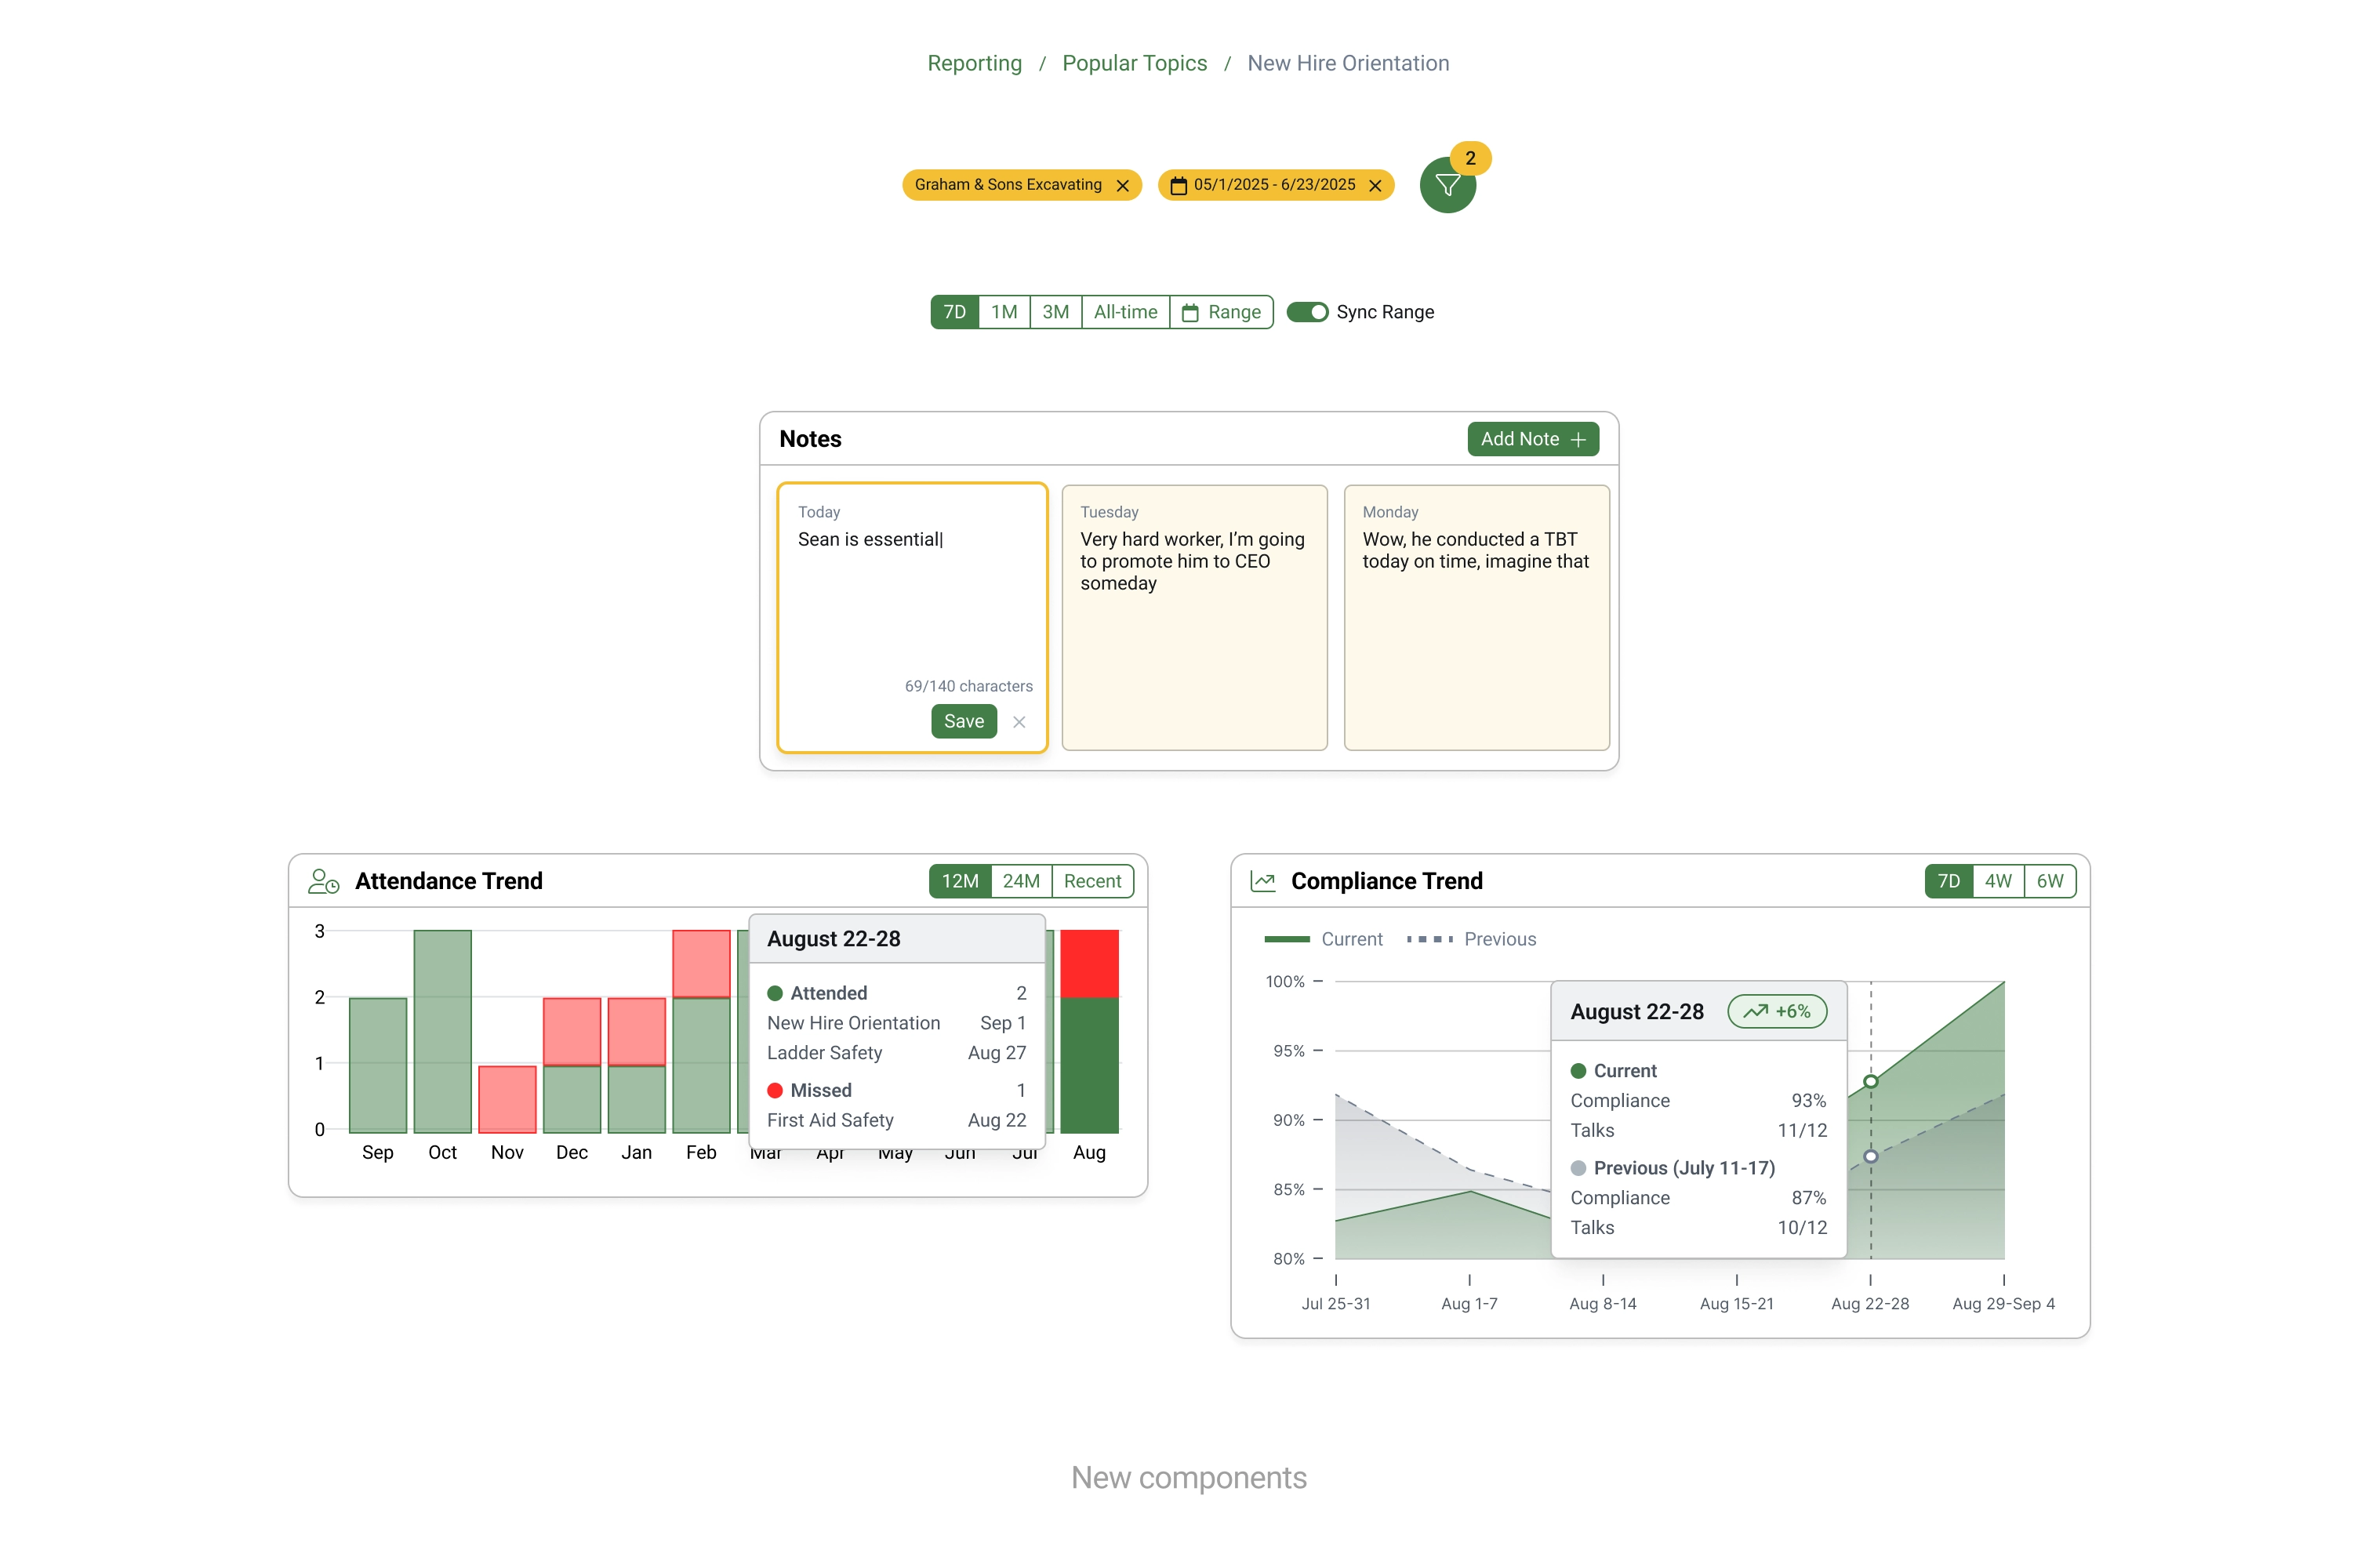
- Popular TBT topics and a compliance graph with current and previous month overlapping
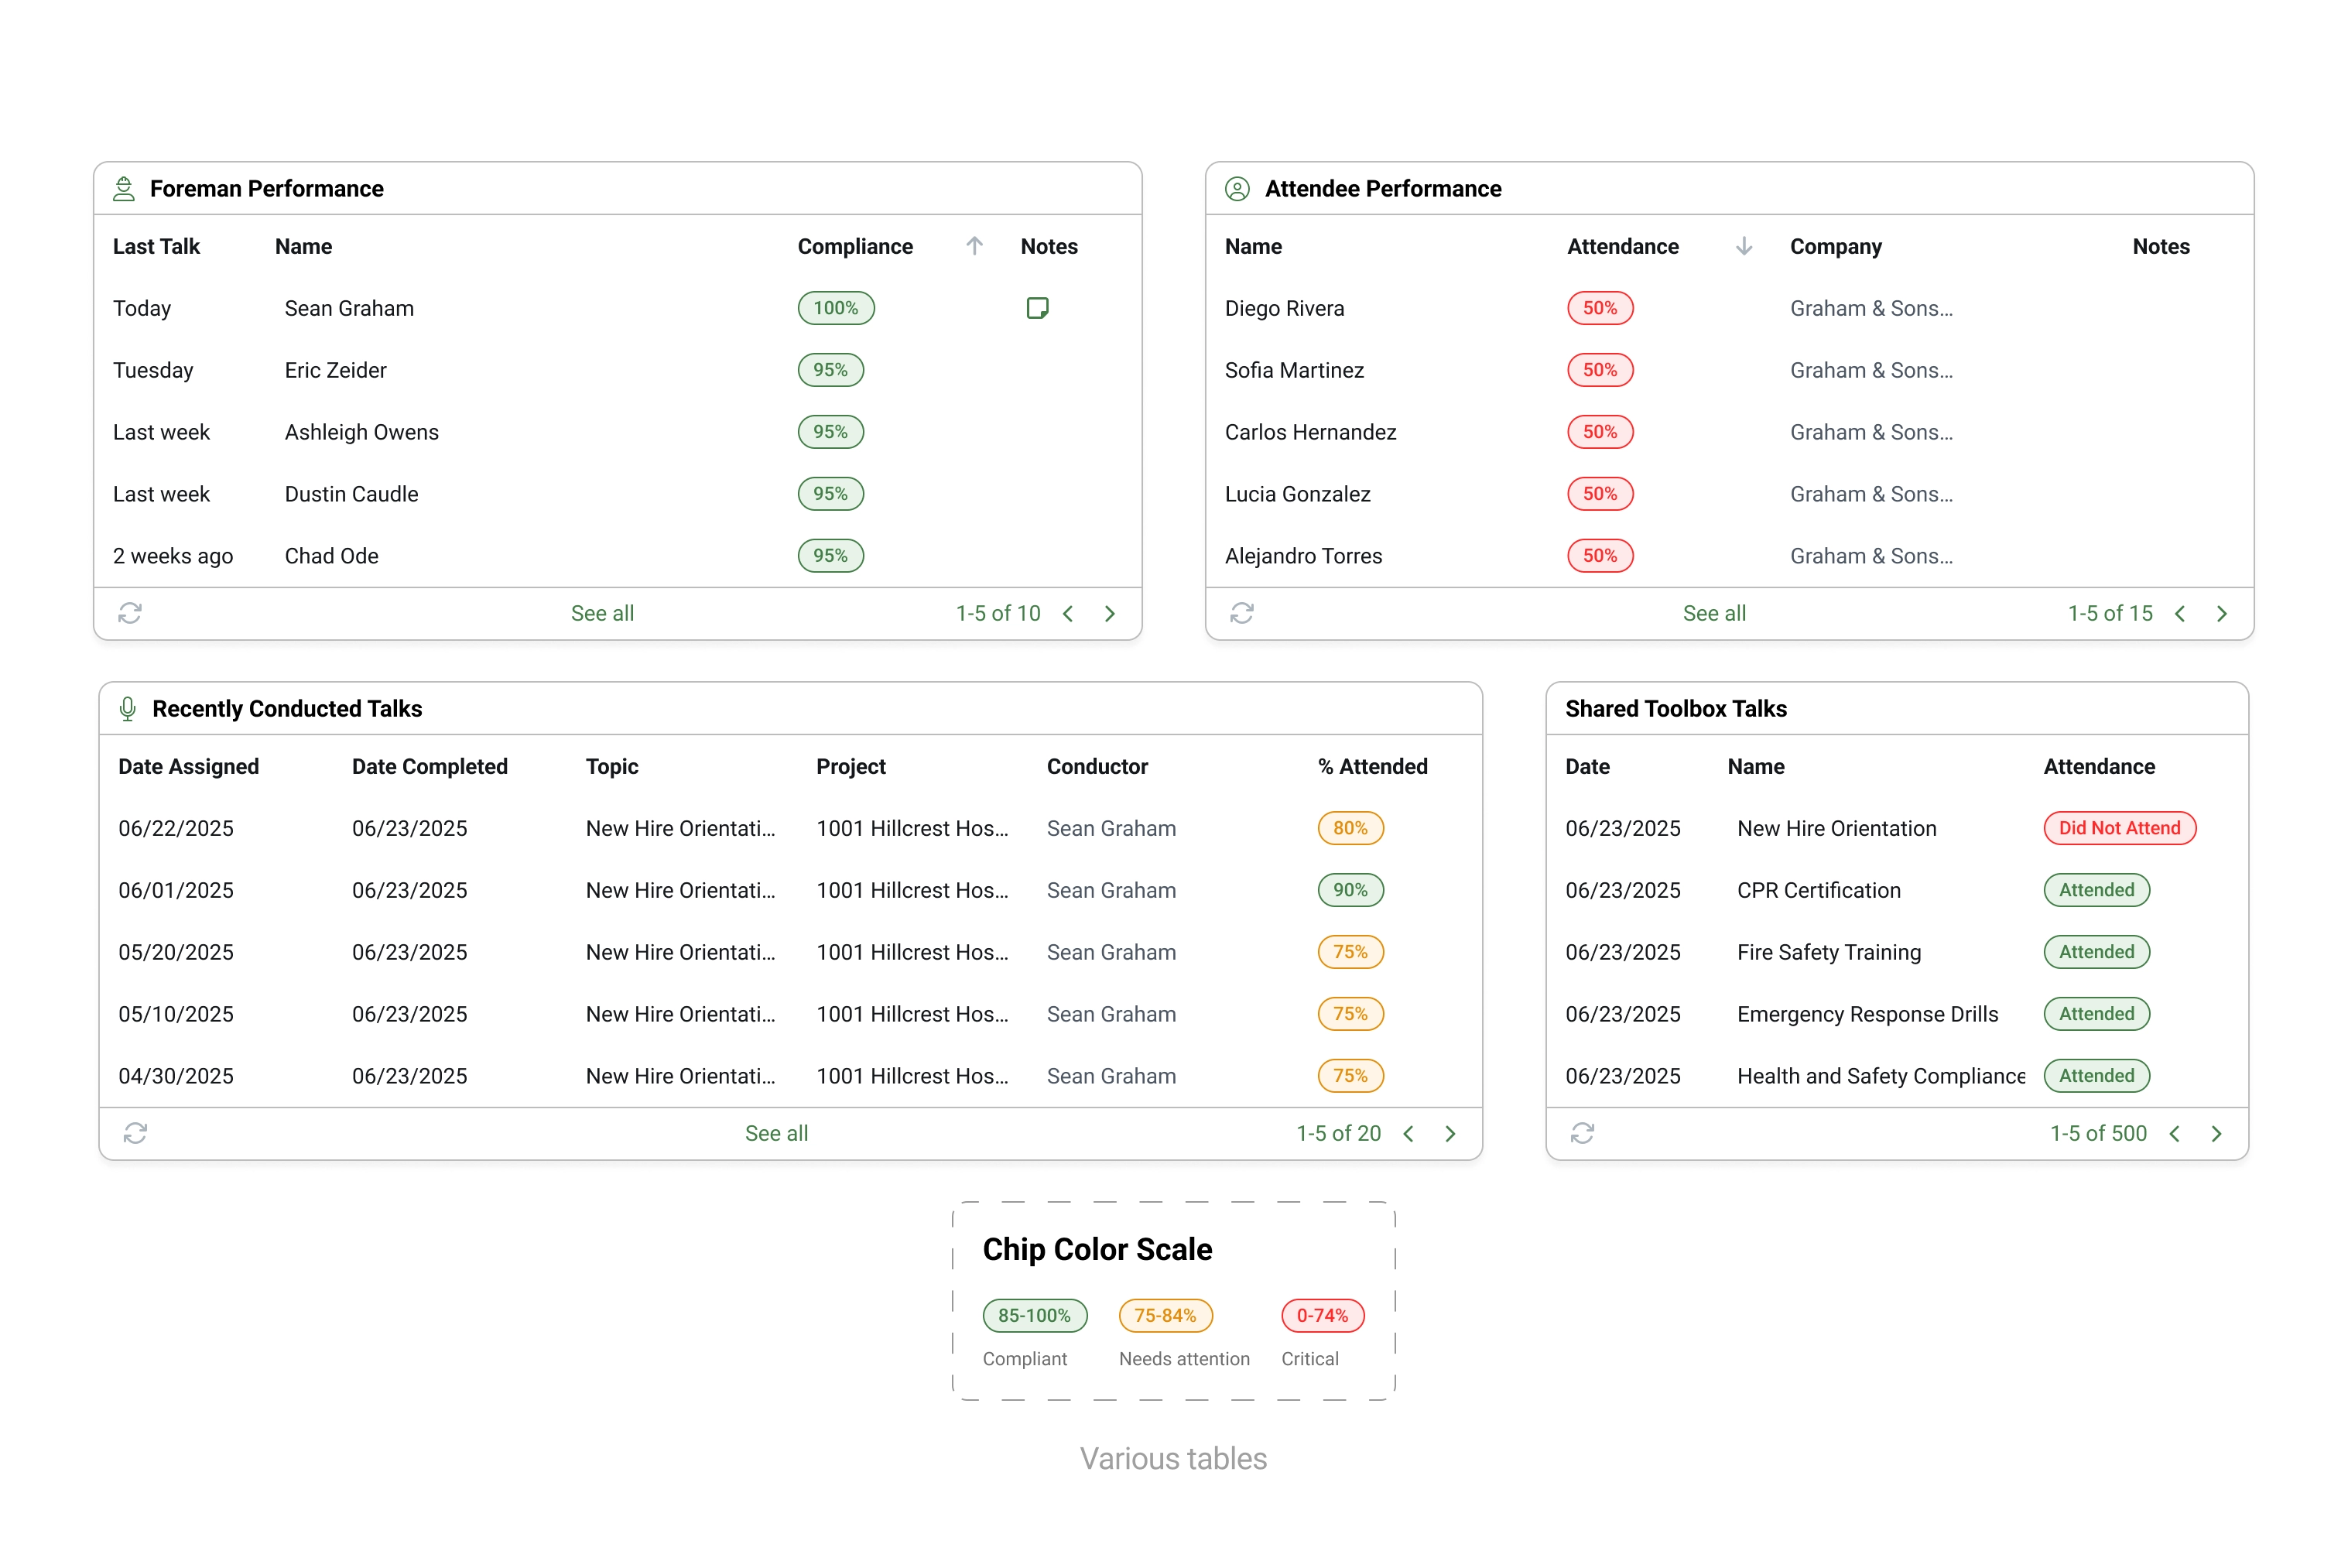
- Foremen and worker performance tables (foremen sorted by most compliant i.e. high achievers, and workers sorted by least compliant i.e. higher risk)
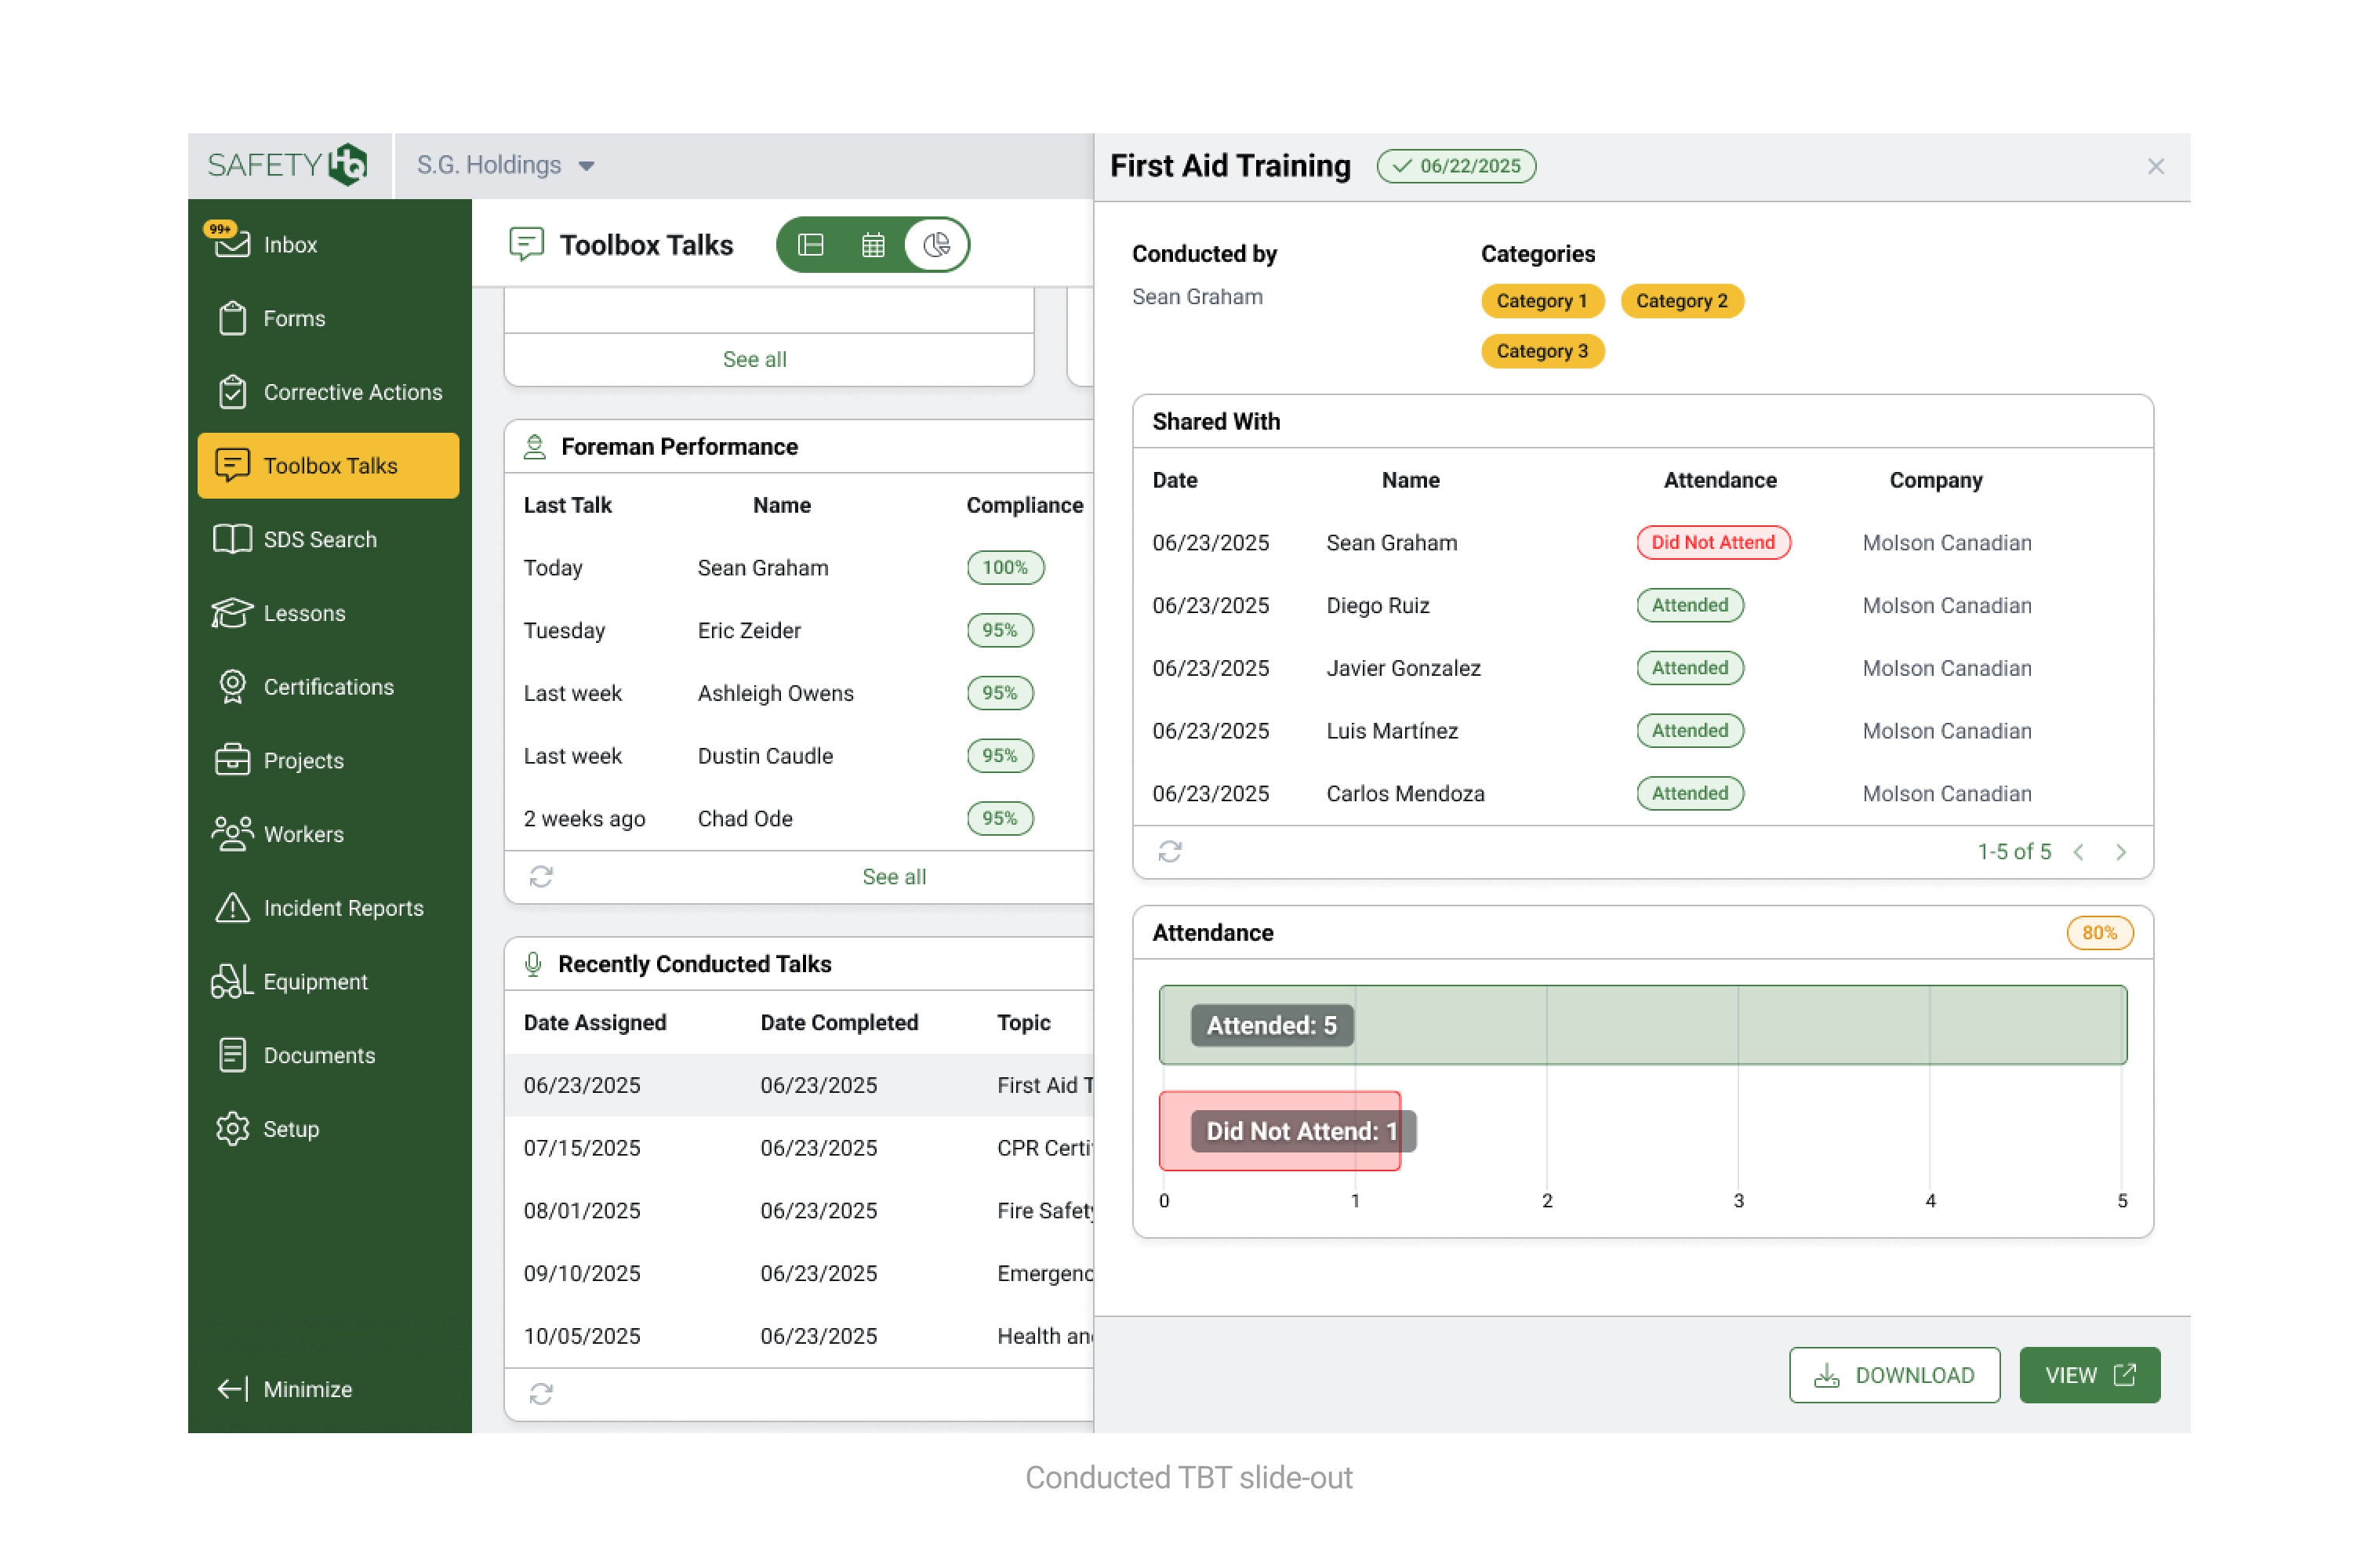
- List of recently conducted talks
This structure helps to make important data easily digestible and discoverable, as well as easily distrubutible, as reports can be downloaded and shared with management.
6. Validation & Testing
Foundation struggles with user outreach, so we leaned on SMEs to gauge that the design affords for the data users are expecting
Without proper user research, the next best thing is often an internal expert that works closely with the users.
This approach is of course not always ideal, but gets us to a point where we can be confident that users will be satisfied, while also expecting constructive feedback for improvement.
7. impact & Reflection
This feature helps position SafetyHQ as the premier construction SaaS product for Toolbox Talks
Safety compliance is on the minds of all construction companies to varying degrees, and SaaS companies know this. There's no shortage of construction SaaS products on the market that offer Toolbox Talks libraries and metric reporting.
SafetyHQ now offers not only an extensive library of Toolbox Talks to help keep workers safe, but now safety managers can keep tabs on company-wide Toolbox Talk compliance to prevent future insurance costs, incidents, injuries and deaths.
Understanding Construction Safety Workflows Through SafetyHQ's Redesign
SafetyHQ needed to integrate with the HQ Suite family of products to retain its 93% retention rate, while eliminating performance risks that threatened customer satisfaction.
93%
Retention Rate
15%
Time-on-Task Reduction

Creating ProVia's Design Center for a B2B to Consumer Market Strategy
ProVia needed to revamp their marketing website, but they also wanted a creative way to showcase the array of product styles they offer.
